Introduction to EnviroInsite
EQuIS EnviroInsite is a toolkit for the analysis and visualization of environmental data. EnviroInsite is a separate desktop application that must be installed on the workstation. EnviroInsite connects directly to an EQuIS database to accesses EQuIS data. EnviroInsite and EQuIS Professional do not need to be installed on the same workstation, however, EQuIS Professional would be required to modify data in the EQuIS database.
|
There are many options to get help with EnviroInsite: •Email the EarthSoft Help Desk: support@earthsoft.com •Context-sensitive online help: Select Help> Contents from within EnviroInsite |
EnviroInsite Workflow
EnviroInsite has multiple capabilities, depending on project needs. Plan out specific needs and objectives with EnviroInsite and then determine which EQuIS database tables need to be populated. Some of the capabilities of EnviroInsite include creating site maps, analyzing stratigraphy, visualizing two-dimensional (2D) and three-dimensional (3D) environmental data, and preparing report graphics. The following is an overview of the principal steps employed to use EnviroInsite to support environmental investigations.
Create Site Maps
A strong site map is a critical component of EnviroInsite. EnviroInsite supports both image file (jpg, tif, bmp, png) and vector file (dxf, dwg, and shp) formats. EnviroInsite can also serve as a Web Mapping Service (WMS) client, meaning that users can automatically obtain aerial images and other mapped data from the many public WMS servers. Image files are ideal for presenting aerial photos, while vector maps are well suited for the display of building, roads, ponds, streams, and other line-based map data. All vector data must be in a common coordinate system, although shapefiles can be converted from latitude-longitude coordinates to a UTM-metric coordinate system. Image files should be selected to present an adequate level of detail, but limit use of image files greater than 10 MB that can bog down the operation of EnviroInsite. If a site-scale aerial photo image does not have adequate resolution for zoomed images, consider having a large-scale image at a relatively low resolution and high-resolution maps for portions of the site in which there is special interest.
See these exercises for more information:
•Connect to EQuIS and Setup Site Maps
Analyze Stratigraphy
Display detailed soil data of the type characteristically entered into both a boring log and interpreted stratigraphy. Detailed page-size boring logs can be generated to document well construction and boring logs. Strip logs present the same type of information in a more compact style. Employ the strip logs to understand the complex site stratigraphy that impacts on the fate and transport of environmental contaminants. Boring log data may be displayed on 2D profiles or as 3D columns in 3D views of the site. Stratigraphy data can also be displayed and modified on profiles or displayed in 3D geologic model and 3D fence diagrams.
See these exercises for more information:
Query and Visualize Environmental Data
The variety of display methods for environmental data far exceeds other comparable analysis and visualization products. Each plot type allows for the point-and-click generation of SQL query statements that allow you to select by constituent(s), sample media, elevation, depth, and date. Where appropriate, aggregate functions can be called to permit calculation and plotting of mean, maximum, minimum, first, or last values. A partial list of mapped environmental data plots include 2D/3D contours, georeferenced data tables, georeferenced time history charts, wells, posted data, classed post plots, georeferenced Stiff diagrams, and georeferenced radial diagrams. Other non-mapped plots that can be generated in EnviroInsite include time history charts, Stiff diagrams, Piper diagrams, Schoeller diagrams, and scatter plots.
See these exercises for more information:
•Single Constituent Plots in Plan View
•Multi-Constituent Plots in Plan View
Prepare Report Graphics
Work in EnviroInsite is for naught if the data is not presented in visually compelling plans and report figures. EnviroInsite has CAD-like layout features that allow the user to generate report figures with complex title blocks, logos, and annotation. Report graphics can be copied through the Windows clipboard directly into presentation or word processing applications. Alternatively, pdf files can be created using the included pdf driver or image files can be exported at a user-specified resolution. EnviroInsite plots can also be exported as CAD or GIS files for fine-tuning of report figures in other software programs.
See these exercises for more information:
EnvironInsite Interface
The EnviroInsite interface is complex but allows the user great flexibility with data analysis and visualization tasks. Various components of the interface are identified in the following graphic. Familiarity with the interface components will facilitate completing the training exercises and increase efficiency with using EnviroInsite.
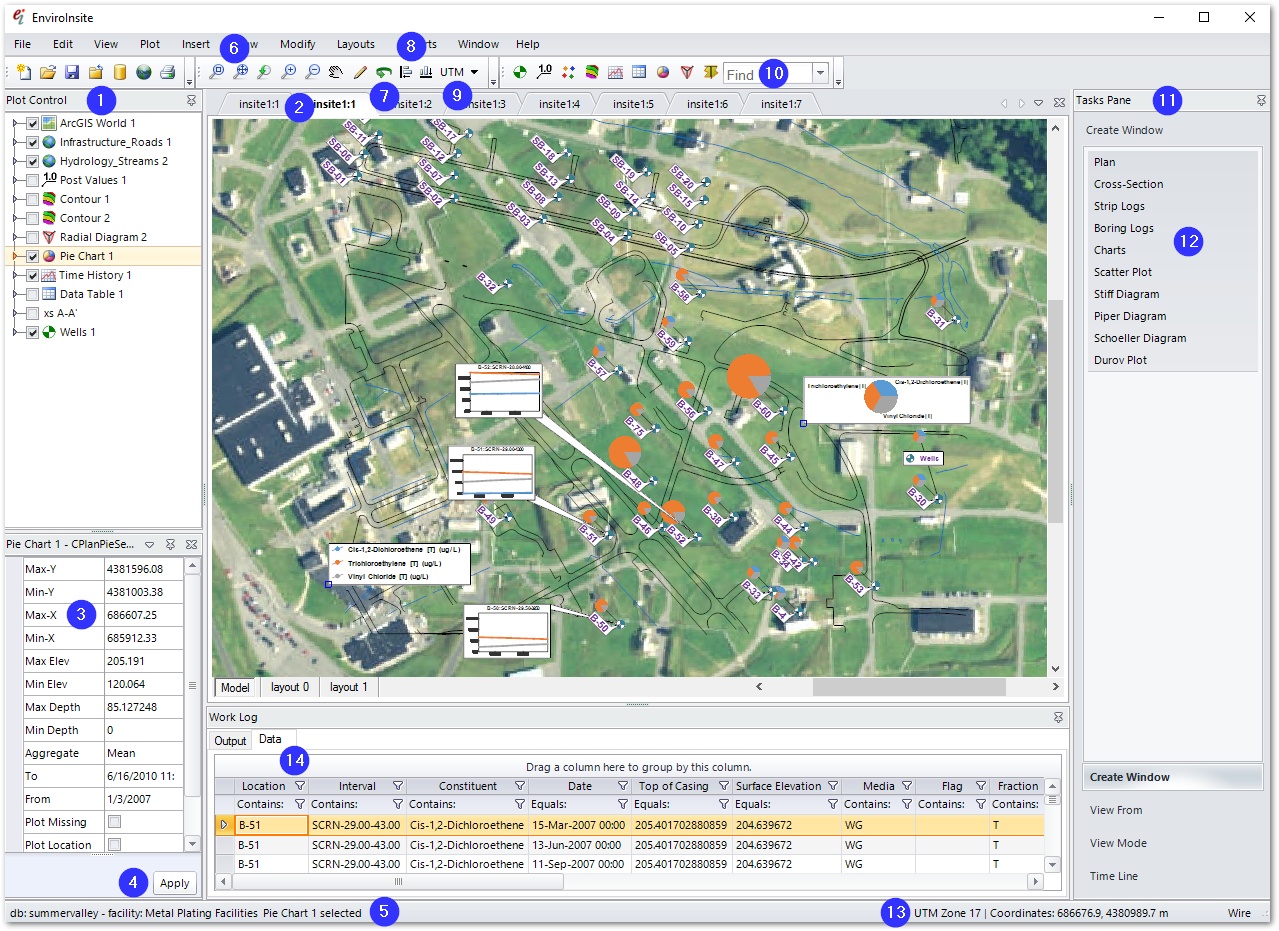
1.Plot Control Panel – Turn off visibility of selected objects.
2.Selectable tab views.
3.Property Grid – Modify group properties of selected object.
4.Apply Button – Redraw selected object based on property grid contents.
5.Name of active EQuIS database file.
6.Zoom and Pan tools.
7.3D Rotation tool.
8.Align graphic primitives like text and rectangles. Select the objects to be aligned and then choose the desired alignment.
9.Coordinate system selection.
10.Find Location drop-down – Select the desired location to highlight it on the map.
11.Tasks Pane – Select from Create Window, View From, View Mode, and Time Line options.
12.Create Window menu selections.
13.Coordinate system, zone, and tracked cursor coordinates.
14.Data grid – Shows queried data used to generate selected objects.
Training Scenario Overview
We will be evaluating data collected at the Metal Plating Facilities. Chemicals of concern in the groundwater are trichloroethylene; cis-1,2dichloroethene; and vinyl chloride. The spatial distribution for groundwater concentration data needs to be evaluated in both plan view and in three dimensions. The stratigraphy for the site also needs to be evaluated to determine how it be impacting groundwater concentrations and chemical migration. Boring logs, geologic cross-sections, and hydrogeologic models will be applied in the evaluation. To facilitate data reporting, custom page layouts for figures will be created.