Overview
Use Strip Logs and two- and three-dimensional methods of displaying boring log and stratigraphy data. There are several different types of plots in EnviroInsite to help create hydrogeologic models, which are described in the table below. Select the specific plot type in the table to view more detailed information pertaining to that plot type in EnviroInsite.
Plot Type |
Description |
|---|---|
Classed Post Contact |
Color-coded symbol plots of boring/stratigraphy contact elevations at monitoring locations that are based on grouping the data into discrete classes (bins). |
Contour Contact |
Contour boring/stratigraphy contact elevations at monitoring locations. |
Geology – Log Location / 3D Log |
Plot location and 3D boring/stratigraphy log. |
Geologic Model |
Draw stratigraphic units in 3D or on profiles. |
Strip Logs |
Display soil, stratigraphy, well construction, individual observations, and charts of geophysical data on a single plot. These plots may be tiled so that you can view and analyze many of the strip logs in a single view window. |
|
Remember that Boring data is the detailed soils data typically provided by a geologist, while Stratigraphy data is the coarser division into hydrogeologic units. Only stratigraphy data may be displayed in plots that interpolate between borings. |
Exercise Scenario
We need to get a better understanding of the geology of the Metal Plating Facilities. We will be using hydrogeological models to plot boring logs and stratigraphy in two- and three-dimensions.
|
Understand how to utilize hydrogeologic data and models in EnviroInsite. |
|
Exercise Objectives |
•Contour a Stratigraphic Unit
•Plot 3D Boring Logs
•Plot 3D Stratigraphy
•Create Stratigraphy Models
Skills, Software and Permissions Required
•.NET Framework 4.6 or higher must be installed on the workstation
•EnviroInsite 2016 must be installed on the workstation
•Read/write permissions are required for the desired facilities
|
Objective: Contour a Stratigraphic Unit |
1.If necessary, re-open the saved "insite1.vizx" file from the previous exercise.
2.Select Window> New> Plan.
3.In the new Plan tab, select Plot> Stratigraphy> Contour.
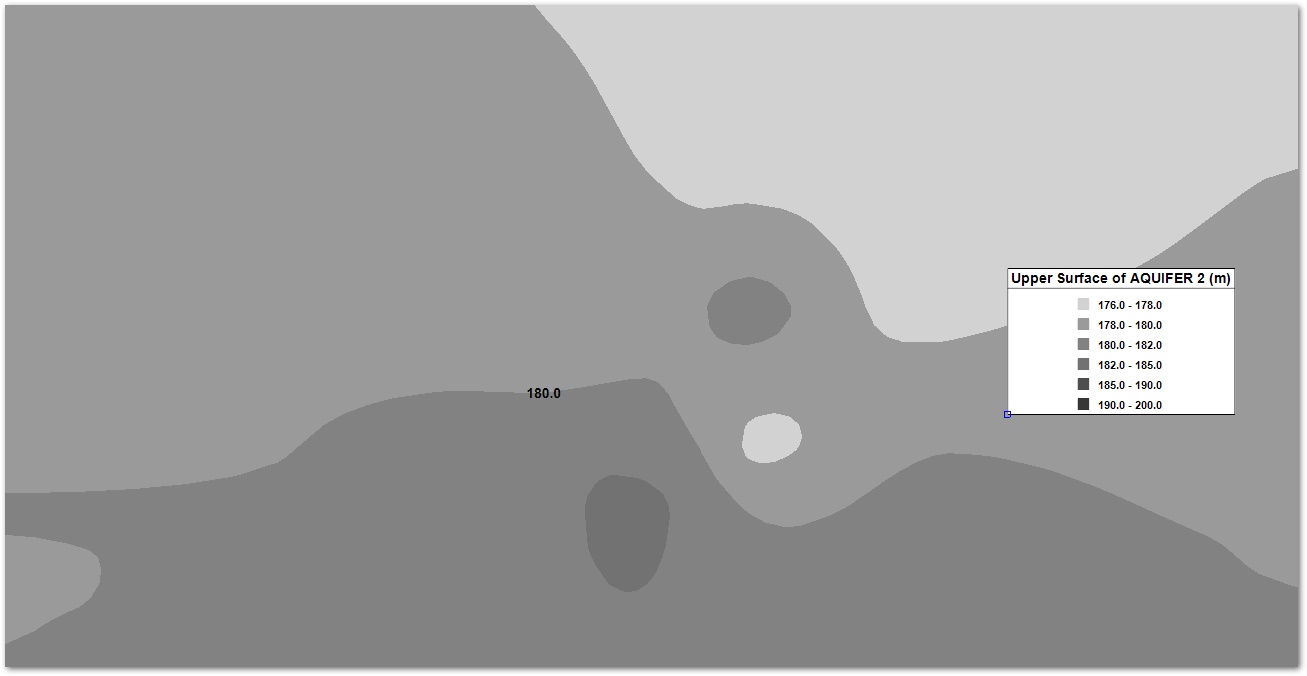
4.On the Query tab, select the desired Stratigraphic unit.
For this exercise, select Aquifer 2.
5.Select Top Elevation to contour the top of the selected formation.
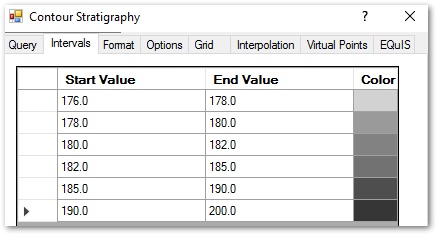
6.Select the Intervals tab.
7.Set the intervals and color scheme as desired. Click on each box to change values.
For this exercise, set the Start Value of the first contour to 176.0 and set the End Values to 178, 180, 182, 185, 190 and 200. Set the colors to varying shades of gray.
8.Select the OK button.
|
There is room for improvement that could be achieved by changing the labeling and interpolation parameters. Make additional changes to these parameters as desired. |
|
Objective: Plot 3D Boring Logs |
1.Turn off the visibility of the Contour Strat 1 layer by removing its check in the Plot Control panel.
2.Select Plot> Geology> 3D Boreholes
3.After reviewing the available options and making any desired changes, select the OK button.
4.Select the View From tab in the Tasks Pane (lower right).
5.On the Tasks Pane select Southwest.
6.Select Edit> Format> Geology.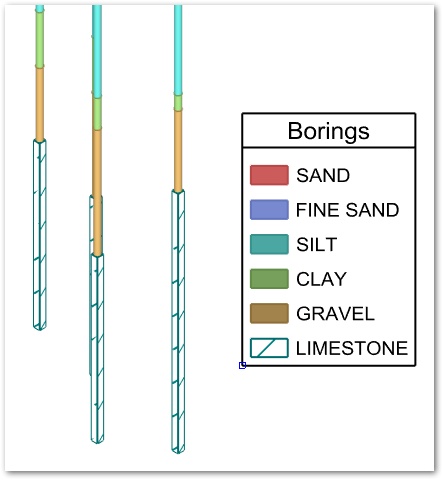
7.Select the desired geologic section.
For this exercise, select Limestone.
8.Select ANSI31 in the Fill Style 1 tab.
9.Set the Hatch Scale to 1.
10.Select the OK button.
11.Select View Mode> Shade w/ Edges from the Tasks Pane on the right to improve the display.
12.Zoom as needed to see the adjusted hatch display.
|
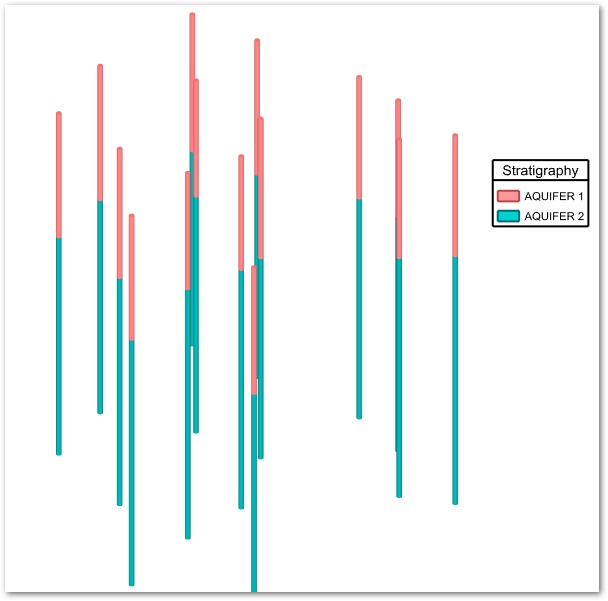
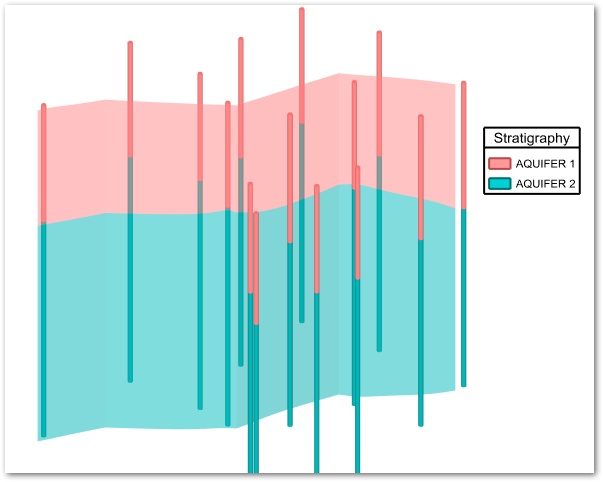
Objective: Plot 3D Stratigraphy |
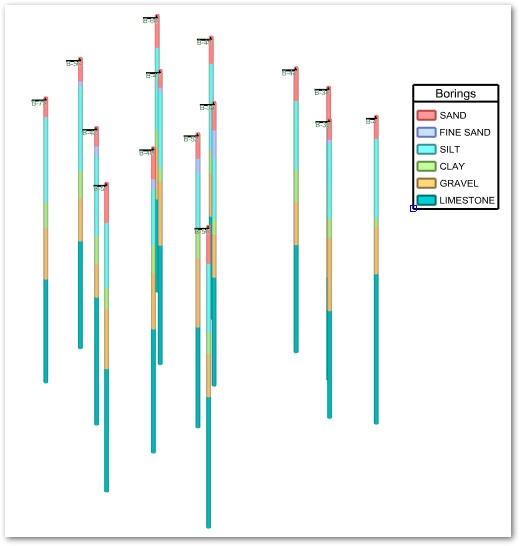
Plotting stratigraphy may be more interesting at this scale than plotting local geology because stratigraphy data allows for interpretation between boreholes.
1.Remove the check from the 3D Boring Logs 1 layer in the Plot Control panel.
2.Select Plot> Stratigraphy> 3D Log.
3.Select the Labels tab
4.Remove the check at Plot Labels.
5.Select the OK button.
6.Select View Mode> Render view from the Tasks Pane on the right to improve the display.
|
The Stratigraphy data has the constraint that the vertical order of the soil classifications must be the same at every location. |
|
Objective: Create Stratigraphy Models |
1.Select Plot> Stratigraphy> Model (the view will automatically rotate to top-down).
2.Single left-click in the plan view to select the points on which a fence diagram will be drawn. Right-click to end the line.
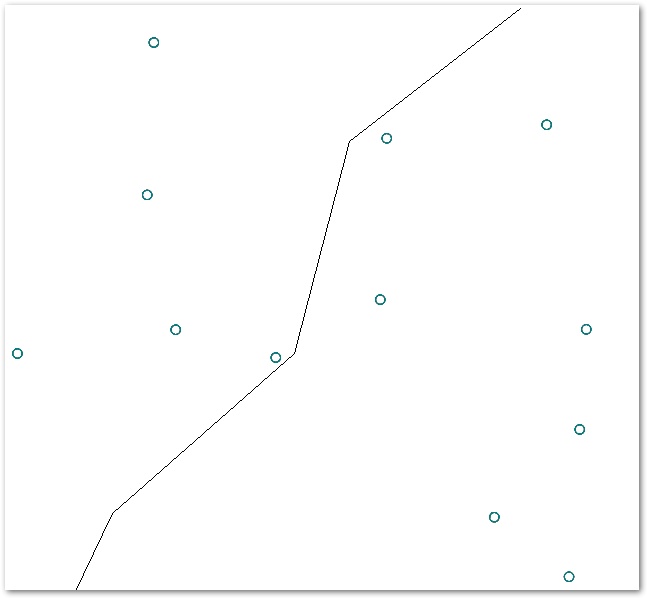
3.In the 3D Stratigraphy dialog box, move all the Stratigraphic units in the Select From list to the Plotted Stratigraphy box using the the Arrow (=>) button.
4.Select the Format tab.
5.Select Fence Diagram in the Plot Type box.
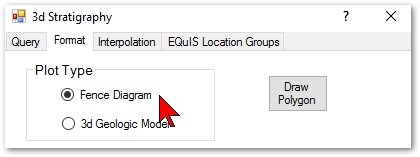
6.Click the OK button.
7.Select View From> Southeast from the Tasks Pane on the right to improve the display.
8.Turn off one or more legends in the Plot Control panel to clean up the view.
|
Objective: Plot Strip Logs |
1.Select Create Window> Strip Logs in the Tasks Pane window.
2.Select the List button in the Location Query box on the bottom of the Options tab.
3.Select the desired locations in the Select From list and click the Arrow (=>) button to move them to the Selected box.
For this exercise, select B-30 through B-49.
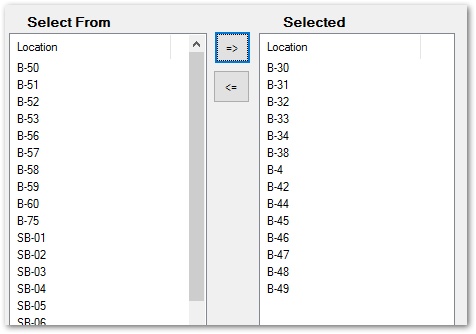
4.Select the OK button.
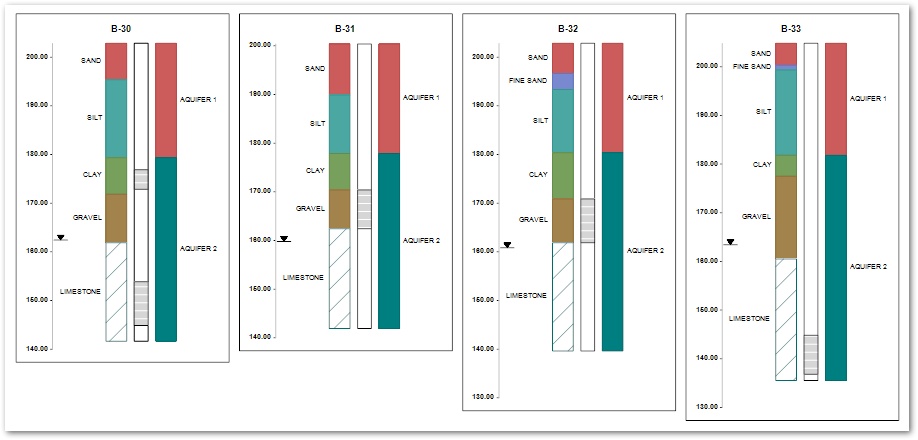
5.On the Options tab, place checks at Stratigraphy, Boring, Axis, Well Screen, and Depth to Water.
6.Select the OK button.
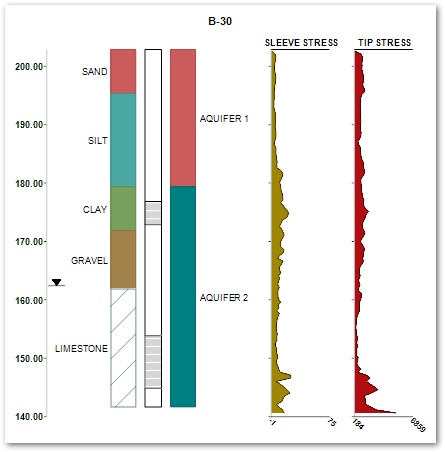
The boring log information appears on the left and the stratigraphy on the right. Notice that the hatch scale defined for the boring logs earlier show in the boring log plots. Notice also that the names of each stratigraphic unit appears next to the interval.
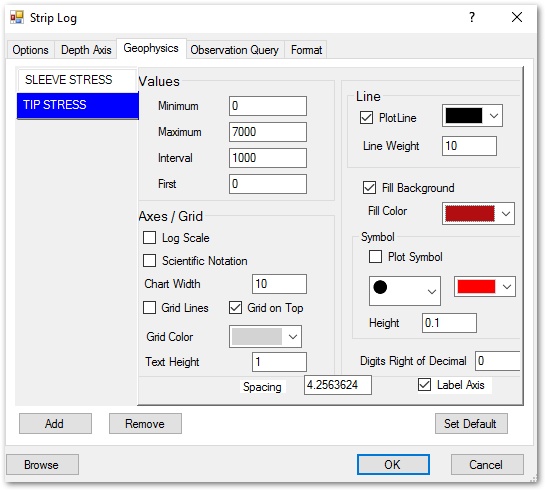
7.Double-click on the Page Logs 1 layer in the Plot Control panel.
8.Select the Geophysics tab.
9.Select the Add button.
10.Select the desired geophysical parameters and move them to the Selected list on the right using the the Arrow (=>) button.
For this exercise, select Sleeve Stress and Tip Stress.
11.Select the OK button.
12.Select the Set Default button at the bottom of the Geophysics tab to see the range of the first geophysical parameter values.
13.Then set the preferred Minimum, Maximum, and Interval as needed.
14.Select the second geophysical parameter and then repeat steps 12-13.
For this exercise, set the Tip Stress Minimum to 0, the Maximum to 7000 and the Interval to 1000.
15.Change the Fill Color to a shade of red to distinguish between the two parameters.
16.Select the Options tab.
17.Place a check at Plot Geophysics Chart.
18.Select the OK button.
19.Zoom in to specific Strip Logs, as desired.