Overview
Rapidly query and display geological information stored within the EQuIS database as two-dimensional cross-sections.
Exercise Scenario
We need to get a better understanding of the geology of the Metal Plating facility by creating geological cross-sections with the data.
|
Understand how to create and customize cross-sections using EnviroInsite. |
|
Exercise Objectives |
•Create Cross-Sections
•Add Wells to Cross-Sections
•Plot Water Levels on Cross-Sections
•Add Time Series Charts to Cross-Sections
•Plot and Edit Stratigraphy
•Adjust Cross-Section Turning Points
Skills, Software and Permissions Required
•.NET Framework 4.6 or higher must be installed on the workstation
•EnviroInsite 2016 must be installed on the workstation
•Read/write permissions are required for the desired facilities
|
Objective: Create Cross-Sections |
1.If necessary, re-open the saved "insite1.vizx" file from the previous exercise.
2.Return to the Insite 1:1 tab and turn off the Data Tables layer.
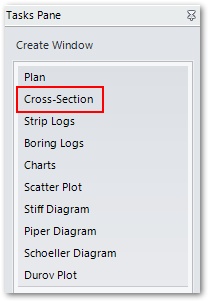
3.Select the Create Window tab in the Tasks Pane on the right-hand side of the screen, and then select Cross-Section.
4.Draw the cross-section line as desired by clicking left-clicking at each end-point.
For this exercise, draw the cross-section line by left-clicking first near B-59, then near B-60, and last near B-4. B-60 is the "Turning Point" for this particular cross-section.
5.Right-click to stop the definition of the cross-section.
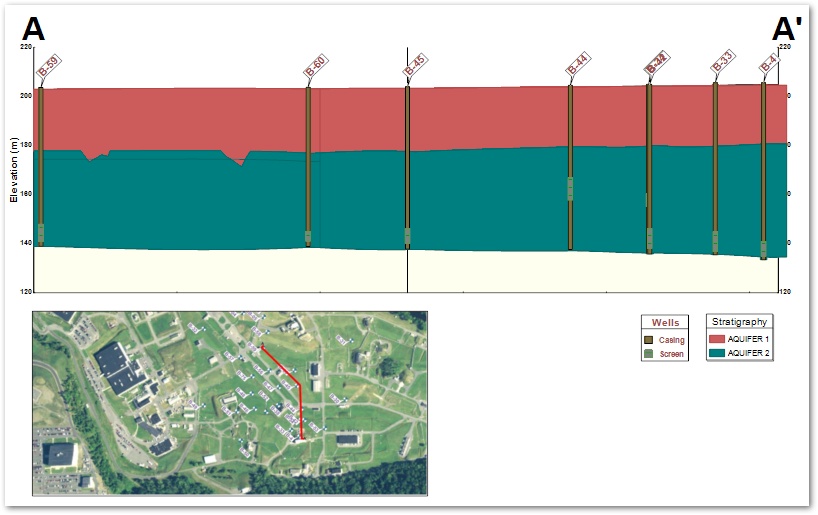
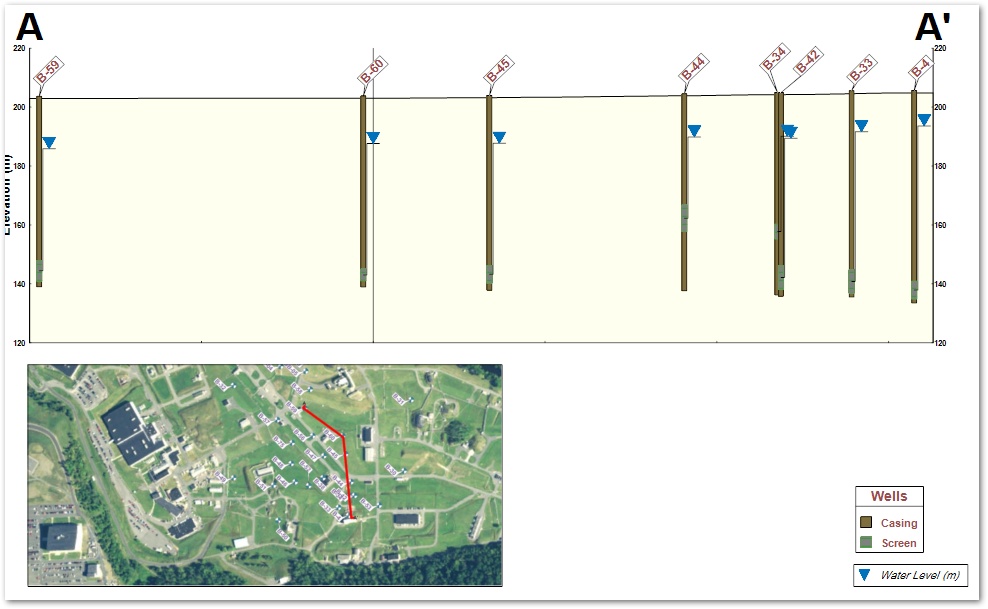
The newly generated cross-section will be plotted in a new window alongside a key map. The cross-section key map will contain whatever objects were visible in the original plan map when the section was defined, in addition to a red line describing the section trace. The bounds of the key map can be modified by editing the object and resetting the bounding corner coordinates.
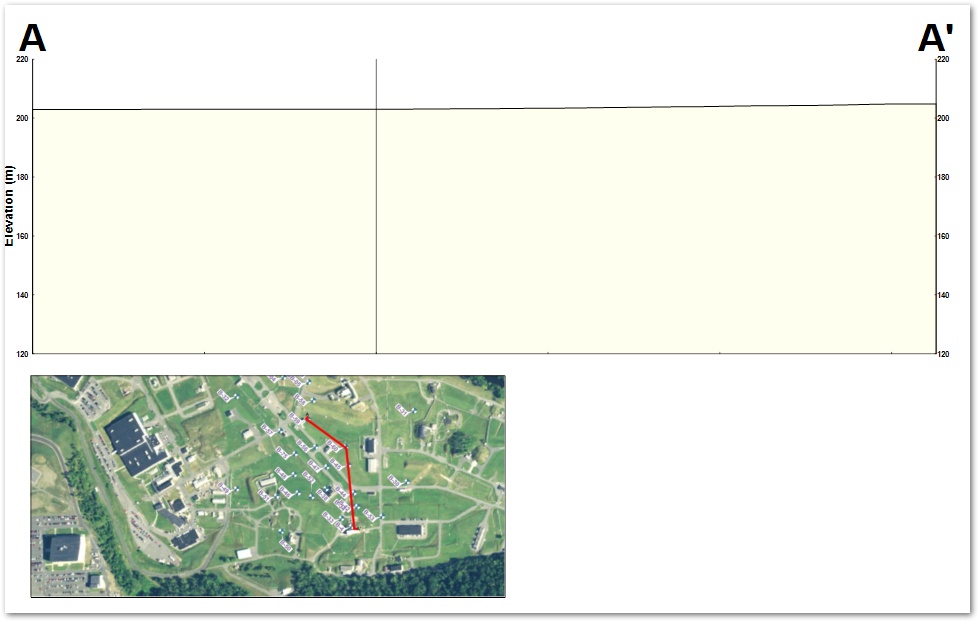
The upper surface of the cross-section is drawn based on the surface elevation values in the Springfield database. This surface can be modified so as to be based on a separate set of location and surface elevation points by editing the cross-section profile plot object.
|
Objective: Add Wells to Cross-Sections |
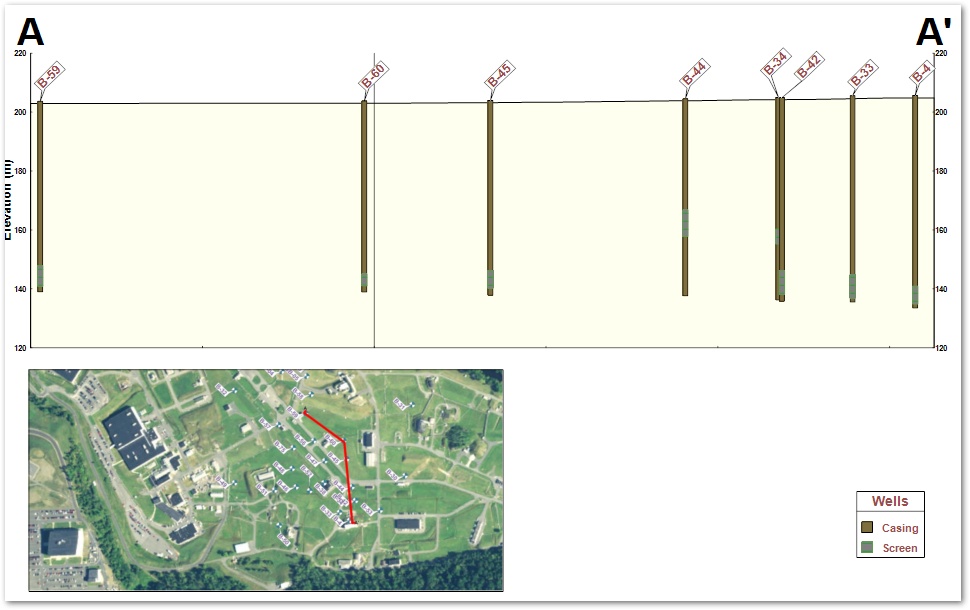
Nearly all cross-section data plots will have a property referred to as the capture distance that is set in a text box near the bottom of the Query tab. The capture distance value establishes how far horizontally an object may be from a cross-section and still be plotted on that section. Locations and screens are plotted at points projected onto the profile from the location.
1.Click Plot> Data and select Locations from the menu.
2.On the Query tab, set Interval ID to SCRN%. (This will limit the plotted intervals to those derived from DT_WELL_SEGMENT.)
3.Click on the Labels tab and set Rotate to -45.
4.Select the OK button.
|
EnviroInsite automatically plots well labels and a legend. Move both around the screen using a mouse. |
|
The color of the well and screen can be changed by double-clicking on any of the wells and selecting the Options tab. The background color can be changed by double-clicking in the area and selecting the Hatch tab. |
5.Drag the label names as needed to separate them.
|
Objective: Plot Water Levels on Cross-Sections |
Plot water level data as an upside down triangle at locations on the profile view.
1.Click Plot> Water Level from the menu and then select Water Level.
2.In the Query tab, click the header row of the Media tab. This will cause the Water Level to move to the top of the constituent list.
3.Select Water Level from the list of constituents.
4.Go to the Options tab and remove the check at Plot Well Symbol.
5.Select the OK button.
|
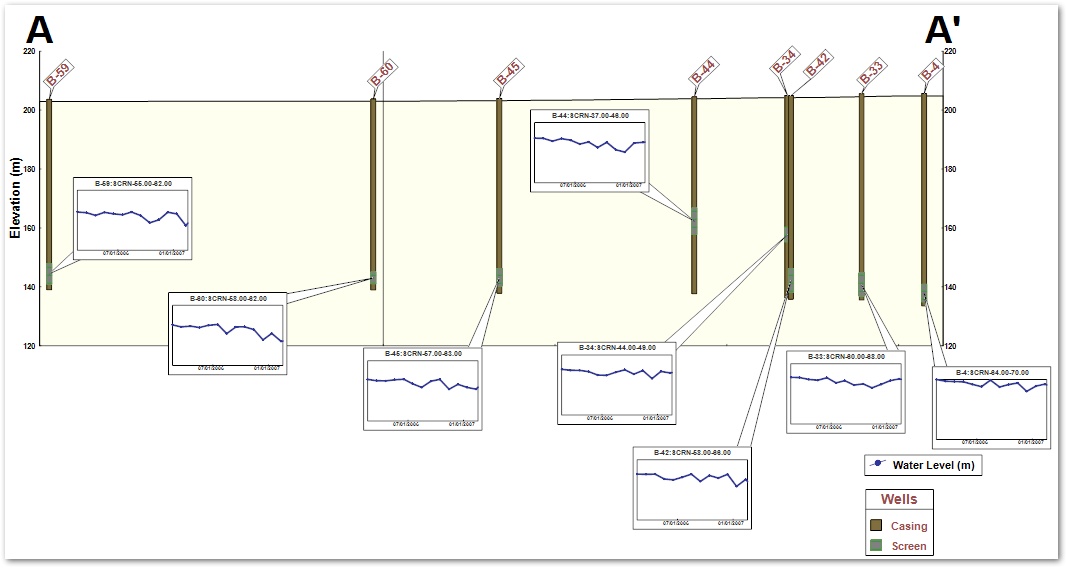
Objective: Add Time Series Charts to Cross-Sections |
1.In the Plot Control panel, uncheck Plan Map and XS Water Levels.
2.Select Plot> Data> Charts.
3.Single-click on Water Level at the top of the list.
4.Single-click on the Arrow (=>) button to move Water Level to the Selected box, and click the OK button.
5.A new dialog box will open.
6.Click the Browse button (at the bottom left corner of the dialog box) to see all of the water level data.
7.Click in the header row of the Date column to sort by Date.
8.Click the Close button.
9.On the other available tabs, make the desired changes to the settings and formats of the charts and then click the OK button.
For this exercise, on the Line Format tab, change the color of both the Line and the Symbol to blue.
On the Time Axis tab, enter the From date as 01-Feb-2006 00:00 and the To date as 01-Feb-2007. Select ½ year for Interval.
On the Left Axis tab, enter180 for Minimum Value and First Label; enter 5.0 for Interval; enter 0 for Digits Right of Decimal.
10.EnviroInsite automatically plots the charts and creates a legend. Move plots and charts around the screen using “Drag and Drop.” Drag the charts around to prevent overlap.
11.Enter the property grid in the lower left-hand corner and change the Height to 35 and the Width
to 45. After changing the width value, click in the property grid to make sure the new width value is accepted.
12.Click the Apply button.
|
Objective: Plot and Edit Stratigraphy |
The plot does not currently present any detailed geological information. The structure of a particular set of strata, or the stratigraphy, can be plotted and edited within cross-sections.
1.In the Plot Control panel, uncheck the XS Time History layer.
1.Select Plot> Stratigraphy from the menu and click Log.
2.Select the Labels tab and uncheck the Plot Labels option.
3.Accept all the defaults and then click the OK button in the dialog box.
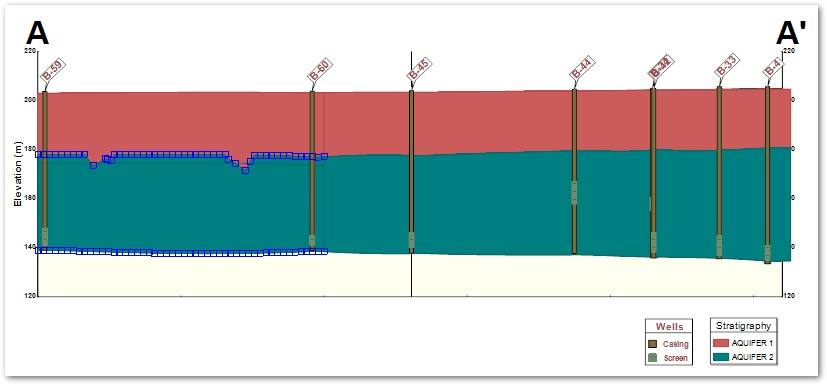
EnviroInsite plots columns on the cross-section representing the observed stratigraphy. The columns represent the data stored the DT_LITHOLOGY.GEO_UNIT_CODE_1 field in EQuIS.
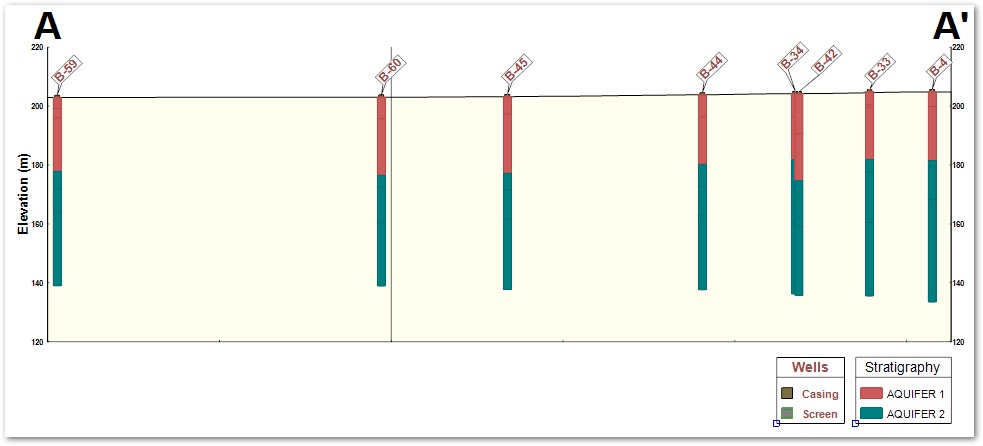
Model the Stratigraphy
Interpolate the stratigraphy contact elevations at boreholes to make a continuous image of the large scale regional stratigraphy.
1.Click Plot> Stratigraphy> Model.
2.In the Select From section of the dialog box, single-click to highlight the first layer and click the Arrow (=>) button to move it to the Plotted Stratigraphy section.
3.Repeat for any other additional layers.
4.Click the OK button.
EnviroInsite now interpolates the stratigraphy between each of the stratigraphical columns, and the information is plotted onto the cross-section.
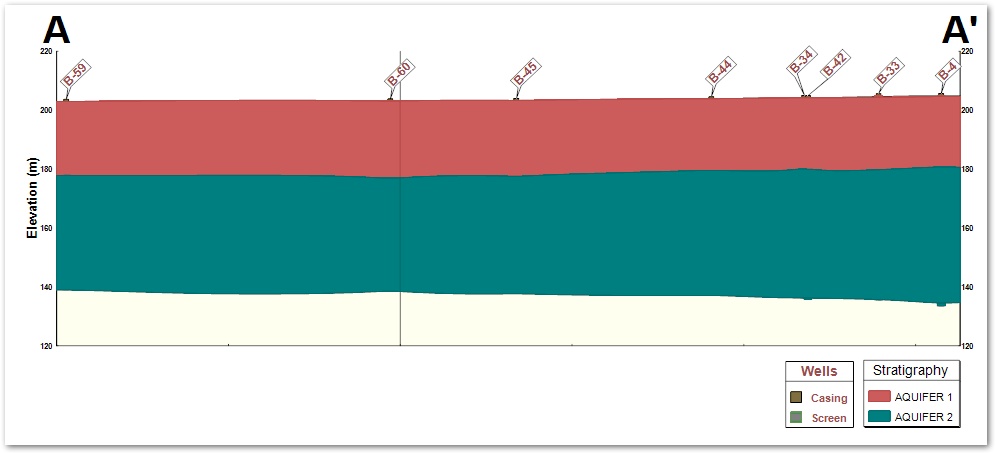
5.The columns are hidden behind the cross-section. In the Plot Control panel, select the
XS Stratigraphy 1 layer and drag it above the XS Interp Log 1 layer so that the model is behind the logs. This allows verification of the stratigraphy interpolation between the boring locations.
6.Turn on the XS Wells layer and drag that object layer below the XS Stratigraphy 1 layer in the Plot Control panel.
|
Computer generated models do not replace the need for professional interpretation of geological sections, particularly in the instance of pinch-out of geological formations. In many cases, geologists may require that the interfaces between the units are adjusted. |
7.To manually edit the stratigraphy model, single-click on one of the plotted model panels, and then select and move the blue dots to a new location.
8."Freeze" these manual edits in place:
a.Double-click on the XS Stratigraphy 1 layer.
b.Select the Format tab and ensure Detach from Data is checked.
c.Click the OK button.
|
If this step is not completed, the next time the file is opened, it will rely only on the raw data and redraw the stratigraphy in its unmodified form. |
|
Objective: Adjust Cross-Section Turning Points |
1.Select the Insite 1:1 tab to return to the plan view.
2.Single-click the profile line in the plan view.
3.Select the profile turning point you want to change by clicking within one of the blue boxes on the profile.
4.Click on the new turning point location.
For this exercise, change the Turning Point from B-60 to B-45.
5.Select the Insite 1:3 tab to return to the cross-section view. Notice that the key map has the new profile alignment and all of the graphics will have redrawn.