Overview
Produce hydro-geochemical diagrams (Piper, Stiff and Schoeller) in EnviroInsite to display spatial and temporal variations in chemical data. Compare the relative concentrations of the principal anions and cations found in ground water and surface water.
The equivalent weight must be entered in the Constituents tab to create geochemistry plots.
|
Equivalent weight is the mass per charge. Charge concentration is the mass concentration of an ion in water divided by the equivalent weight. |
Exercise Scenario
We want to create several hydro-geochemical diagrams to evaluate the geochemistry at our Metal Plating Facility.
|
Creation of these diagrams requires that the EQuIS database is populated with anion and cation data. |
|
Exercise Objectives |
•Plot Conventional Stiff Diagrams
•Plot Georeferenced Stiff Diagrams
•Create Piper Diagrams
•Generate Schoeller Plots
Skills, Software and Permissions Required
•.NET Framework 4.6 or higher must be installed on the workstation
•EnviroInsite 2016 must be installed on the workstation
•Read/write permissions are required for the desired facilities
|
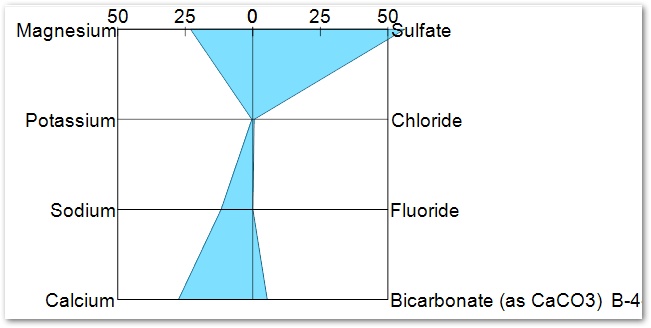
Objective: Plot Conventional Stiff Diagrams |
Stiff diagrams are graphical presentations of the cation and anion content of water presented in milliequivalents per liter. They may be plotted all on a single page, on a cross-section, or may be georeferenced in plan view.
1.If necessary, re-open the saved "insite1.vizx" file from the previous exercise.
2.Select the Create Window tab in the Tasks Pane on the right-hand side of the screen, and then select Stiff Diagram. This creates a new window and opens a Stiff Diagram dialogue box.
3.In the Query tab, select a Data Transform of Maximum.
4.Select the other parameters as desired.
For this exercise, select a Media of WG, a Fraction of D, and for the Location ID enter B-4%.
5.Select the OK button. EnviroInsite performs the defined query and plots the Stiff diagrams.
6.Select Zoom Window ![]() and zoom in to examine the results.
and zoom in to examine the results.
7.Select File> Export> PDF to export the Stiff Diagrams to a .pdf file.
8.Select the OK button to accept the default .pdf file path and open a Preview window.
9.Ensure Portrait is the paper orientation.
10.Select the Center to Paper button in the Plot Margins section.
11.To perfect the result, enter 0.5 for the Top and Bottom margins and select Update.
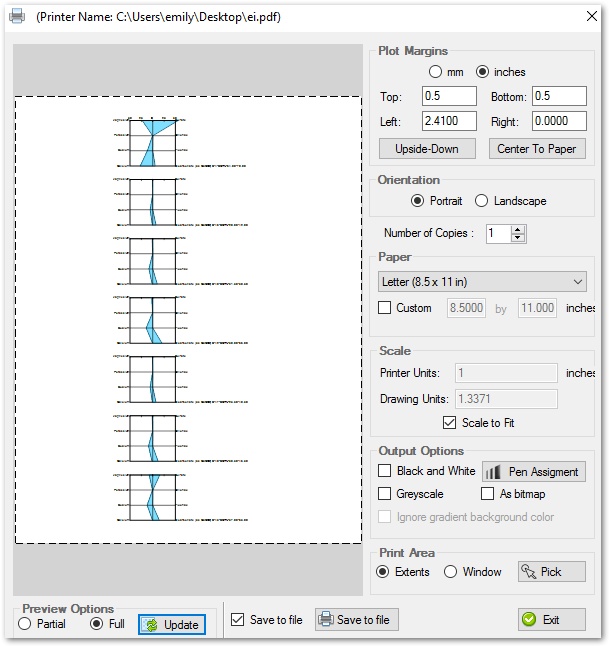
12.Click the Save to File button to create the .pdf file.
|
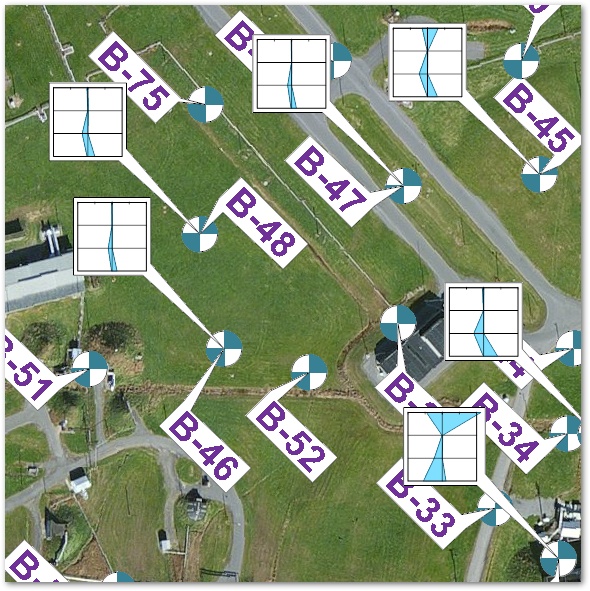
Objective: Plot Georeferenced Stiff Diagrams |
1.Return to the Insite1:1 tab.
2.Click Plot> 2D Data from the EnviroInsite menu and select Stiff Diagram.
3.In the Query tab, select a Data Transform of Maximum.
4.Make the desired parameter selections.
For this exercise, select a Media of WG, a Fraction of D and for the Location ID enter B-4%.
5.Select the Labels tab.
6.Remove the check next to Post Interval ID.
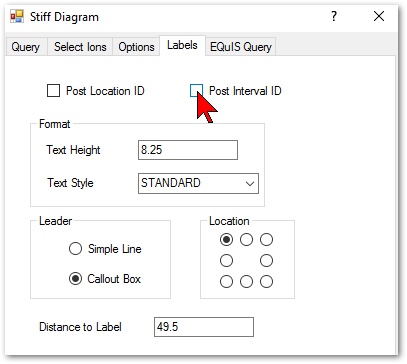
7.Click the OK button. EnviroInsite performs the defined query and plots the Stiff diagrams on the map adjacent to the well locations. The Stiff diagrams may be moved around the map using drag and drop.
8.Zoom in as desired to better view the georeferenced Stiff diagrams.
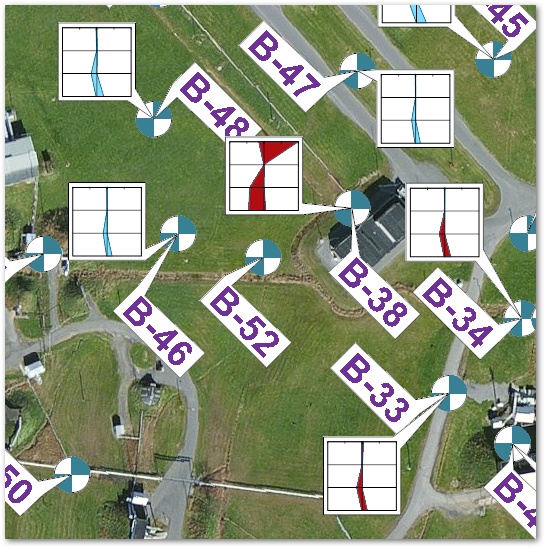
Plot a Different Set of Stiff Diagrams for Data Comparison
Examine the difference in chemistry between two sets of locations. This is often useful when the two groups of locations selected are screened at different depths.
1.In the Plot Control panel on the left hand side of the screen, right-click the Stiff Diagram 1 layer and select Duplicate.
2.Double-click the Stiff Diagram 2 layer in the Plot Control panel to open the Stiff Diagram dialogue box.
3.Change the parameters, as desired.
For this exercise, enter B-3% in the Location ID on the Query tab.
4.Select the Options tab.
5.Change Fill Color to red.
6.Click the OK button. Both sets of Stiff Diagrams are now on the same map.
|
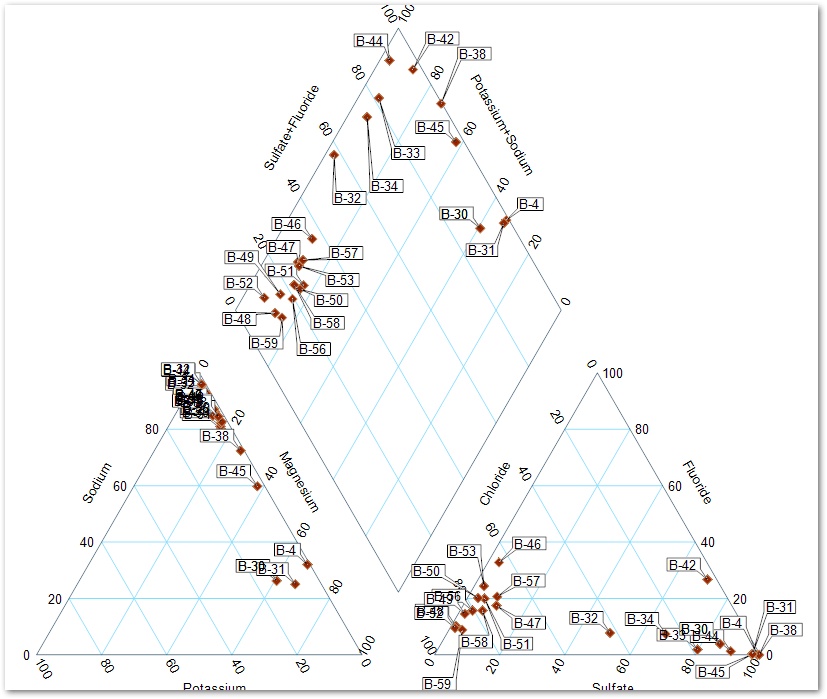
Objective: Create Piper Diagrams |
A Piper diagram is a form of the trilinear diagram. The Piper diagram has two simple triangular plots on the right and left side of a four-sided center field.
1.Select Window> New> Piper Diagram. A Piper Diagram dialogue box opens.
2.In the Query tab make the desired selections.
For this exercise, select WG for the Media and select D for Fraction.
3.Click the OK button. EnviroInsite performs the defined query and plots the Piper diagram.
|
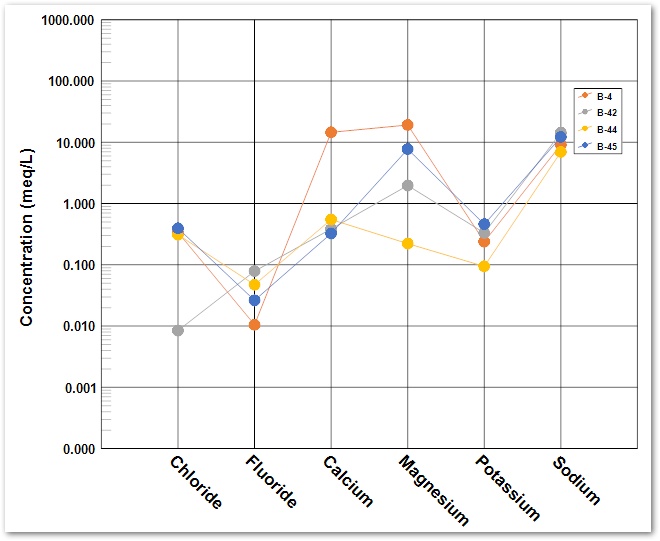
Objective: Generate Schoeller Diagrams |
Schoeller diagrams are used to show the relative concentrations of anions and cations typically expressed in milliequivalents per liter. Multiple samples from different wells may be plotted on a single diagram to distinguish similar patterns in the ratios of particular anions and cations. Water concentrations are a function of the groundwater geochemistry and the chemical composition of the aquifer rock material.
1.From the Tasks Pane on the right hand side of the screen, select Schoeller Diagram.
2.On the Query tab in the Schoeller Diagram dialogue box, select the desired anions and cations and then click on the Arrow (=>) button to transfer the selected items to the Selected box.
For this exercise, select the following analytes, all with a Media of WG and a Fraction of D: Calcium, Chloride, Fluoride, Magnesium, Potassium and Sodium.
|
The order that the constituents are listed in the Selected box establishes the order they are presented in the graph. Constituents can be reordered by clicking on a constituent and dragging it to the desired place. |
3.Select the desired locations to be plotted and then click on the Arrow (=>) button.
For this exercise, select B-4, B-42, B-44 and B-45.
4.Click the OK button. EnviroInsite performs the defined query and plots the Schoeller diagram.