Overview
Three-dimensional (3D) constituent plots can be produced in EnviroInsite with data from EQuIS. Data that can be plotted includes chemical analytical results, water quality parameters, and water elevations. There are many different types of 3D constituent plots in EnviroInsite, some of which are described in the table below.
Plot Type |
Plot Description |
|---|---|
3D Locations |
Displays the entire sample interval and depth of monitoring locations. |
3D Contours |
Fill or line contours of interpolated results over a three-dimensional area. The difference between two contour lines is defined as the contour interval, which indicates the relative slope of the surface. |
Classed Posts |
Color-coded symbols posted at monitoring locations that are based on grouping the data into discrete classes (bins). The color and radius of the symbol are dependent on the value of the selected constituent at that monitoring location. |
3D Surfaces |
3D draped surfaces of constituents based on water level or ground surface values. |
Exercise Scenario
We want to add 3D data to the map to understand how our contamination is spreading under the surface at the facility.
|
Explore the many types of 3D constituent plots to understand the spatial distribution of chemicals of concern. |
|
Exercise Objectives |
•Create 3D Classed Posts
•Create 3D Contour Plots
•Drape Shapefiles Across 3D Surfaces
Skills, Software and Permissions Required
•.NET Framework 4.6 or higher must be installed on the workstation
•EnviroInsite 2016 must be installed on the workstation
•Read/write permissions are required for the desired facilities
|
Objective: Create 3D Classed Posts |
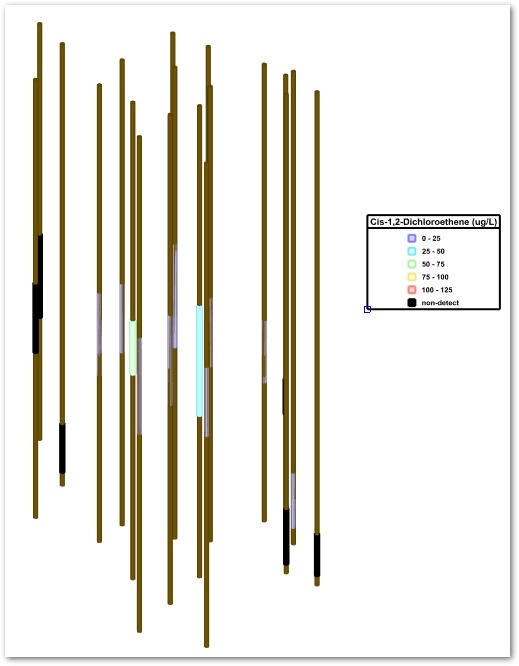
A classed post plot uses a colored symbol to indicate the magnitude of concentration or some other property. Create unique classed post plots in 2D, in a cross-section, or in 3D. In 2D, the symbols are simply flat colored symbols on a map. On a cross-section and in 3D, the entire sample interval section is colored filled, based on the reported value.
1.If necessary, re-open the saved "insite1.vizx" file from the previous exercise.
2.Select Window and click New> Plan.
3.In the new window that opens, select View> Options.
4.Go to the Options tab and set the Vertical Exaggeration to 10.
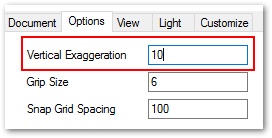
5.Select the OK button.
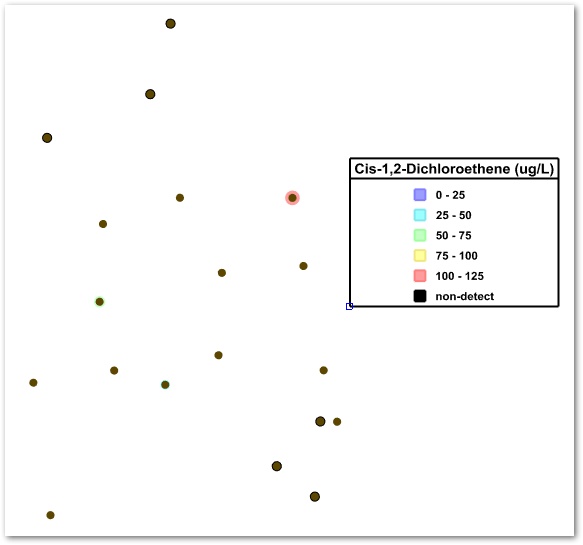
6.Select Plot> 3d Data> Classed Post.
7.In the Query tab make the desired constituent selections.
For this exercise, select Cis-1,2Dichloroethene with a Matrix of WG and a Fraction of T.
8.Select Data Transform as Maximum
9.Click the Update button in the Data Summary section.
10.Select the Intervals tab.
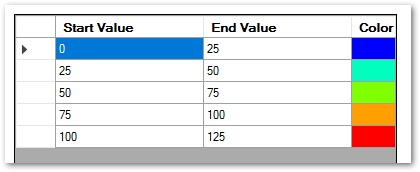
11.Select Set Intervals> Setup.
12.Specify the Minimum, Maximum and Interval as desired.
For this exercise, set the Minimum to 0, the Maximum to 125 and the Interval to 25.
13.Click the OK button to return to the Intervals Tab.
14.Select the OK button.
15.Select the View From tab in the Tasks Pane (lower right).
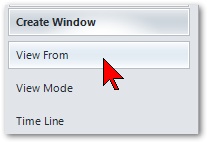
16.On the Tasks Pane select Southwest.
|
Objective: Create 3D Contour Plots |
1.Select Plot> 3d Data> Contour.
2.In the Query tab select the desired constituent.
For this exercise, select Cis-1,2Dichloroethene with a Matrix of WG and a Fraction of T.
3.Select Data Transform as Maximum
4.Click the Update button in the Data Summary section.
5.Select the Intervals tab.
6.Select Set Intervals> Setup.
7.Specify the Minimum, Maximum and Interval as desired.
For this exercise, set the Minimum to 0, the Maximum to 125 and the Interval to 25.
8.Click the OK button to return to the Intervals Tab.
9.Select the Interpolation tab.
10.Choose Kriging from the Method drop-down.
11.Select the OK button.
12.Before defining a more limited grid, it will be easier to draw the grid if View From is changed back to Top.
13.To open the 3D Contours dialog box to edit the grid, either double left click on the 3D contour or right click and then select Edit.
14.Select the Grid tab.
15.Select Draw Grid and draw a rectangle around the locations of interest.
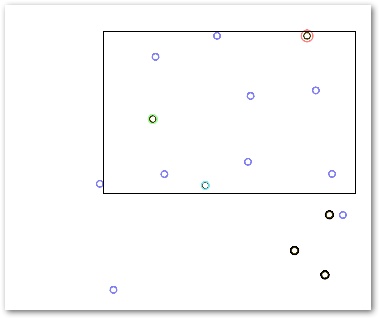
16.Select the OK button.
17.Select the View From tab in the Tasks Pane.
18.Select Southwest again.
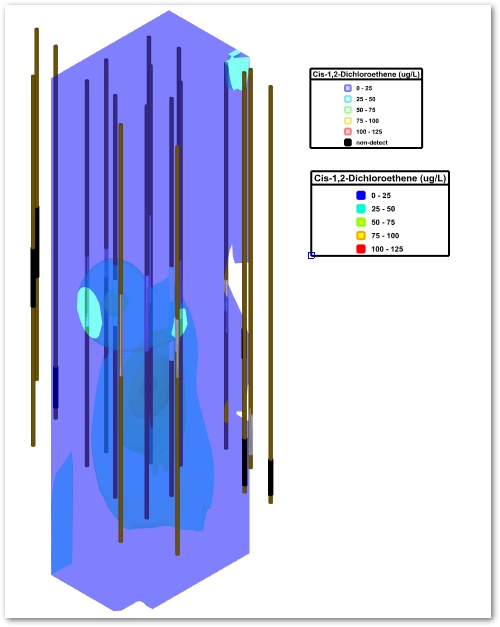
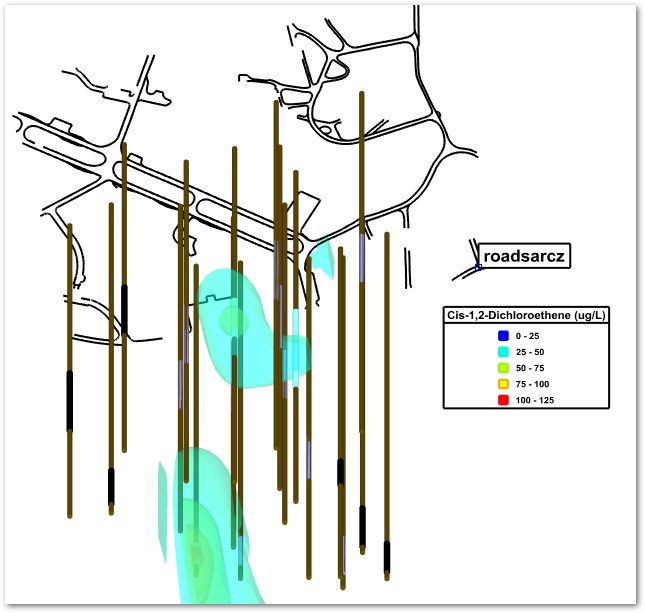
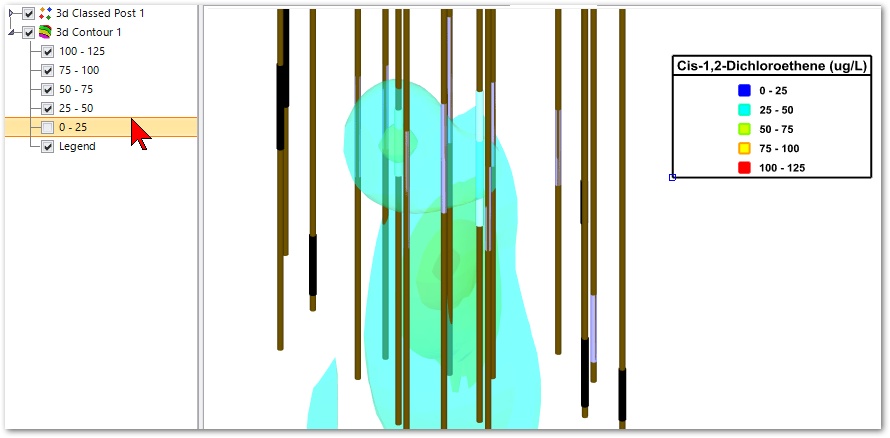
19.Expand the tree view in the Plot Control panel to expose the fill contours and remove the checks in the lower valued contours to reveal the core contour components.
|
Objective: Drape Shapefiles Across 3D Surfaces |
1.Select Insert> Shapefile.
2.Browse to find the desired shapefile.
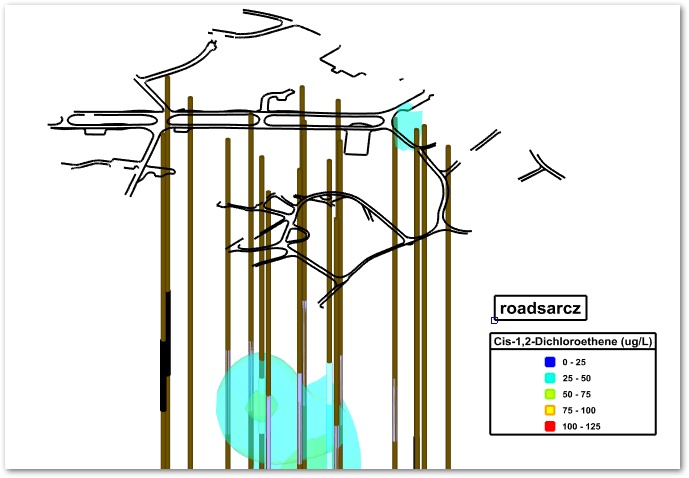
For this exercise, browse to the "roadsarcz.shp" file.
3.Place a check at Drape on Surface.
4.Go to the Crop tab and check Crop to Rectangle.
5.Under the Options section, select Clip Shapes at Rectangle.
6.Click the OK button.
7.Select the 3D Rotation tool ![]() from the toolbar to spin the view around to get a better perspective.
from the toolbar to spin the view around to get a better perspective.
8.Single-click once in the window to set a spin axis.
9.Left-click and hold to move the cursor around to spin the window to change the angle.
10.Right-click once to exit the spin and re-draw the legends to face forward.