Overview
Connect to EQuIS directly within EnviroInsite with only EnviroInsite installed. Setup site maps for preparation for additional analysis in EnviroInsite.
Exercise Scenario
We need to use EnviroInsite to perform different analyses and visualizations of our Metal Plating Facilities data in EQuIS. First, we need to connect to our data in EQuIS and then plot our Metal Plating locations.
|
Learn how to connect EnviroInsite to an EQuIS database and prepare maps to use for data analysis. |
|
Exercise Objectives |
•Connect to an EQuIS Database in EnviroInsite
•Plot EQuIS Locations
•Add ArcGIS Online Basemaps
•Insert Shapefiles
•Save EnviroInsite Documents
Skills, Software and Permissions Required
•.NET Framework 4.6 or higher must be installed on the workstation
•EnviroInsite 2016 must be installed on the workstation
•Read/write permissions are required for the desired facilities
|
Note that EQuIS Professional does not need to be installed to access EnviroInsite. |
|
Objective: Connect to an EQuIS Database in EnviroInsite |
1.Launch EnviroInsite 2016 ![]() from the Start menu.
from the Start menu.
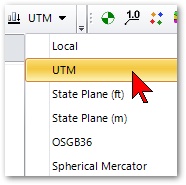
2.When EnviroInsite opens, locate the “Local” drop-down menu on the toolbar and select UTM, if not already set.
3.Select File> Open Database> EQuIS Database.
4.Navigate to the desired facility within the EQuIS Login screen and double-click to login.
For this exercise, navigate to the "Springfield" facility in the EQuIS Training Database within the EQuIS Login screen and double-click the facility to login.
5.The EQuIS Options dialog will open. Make the desired selections.
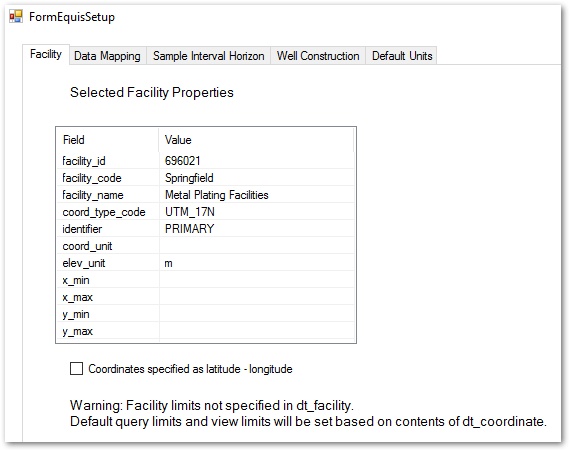
For this exercise, select the Data Mapping tab from the EQuIS Options dialog box and make the following selections:
Option |
Selection |
|---|---|
Non-detect Multiplier |
1.0 |
Water Elevation> Reported Value |
DT_WATER_LEVEL.WATER_LEVEL.ELEV |
Data Qualifier Field |
INTERPRETED_QUALIFIERS |
Location ID |
SYS_LOC_CODE |
6.Click the OK button to complete the EQuIS connection in EnviroInsite.
7.Select View> Options.
8.Select the desired necessary options for the coordinate system.
For this exercise, set UTM Longitude Zone to 17.
|
EnviroInsite can convert from Latitude-Longitude coordinates to UTM, State Plane, or Spherical Mercator. If DT_FACILITY in EQuIS is setup to use Lat-Long coordinates, then EnviroInsite will automatically set the UTM and State Plane Zones. |
9.Select the OK button.
|
Return to the EQuIS Options dialog in EnviroInsite later by selecting Edit> EQuIS Options. |
|
Objective: Plot EQuIS Locations |
Plot and query sampling locations from EQuIS by depth, elevation, location window, or location type.
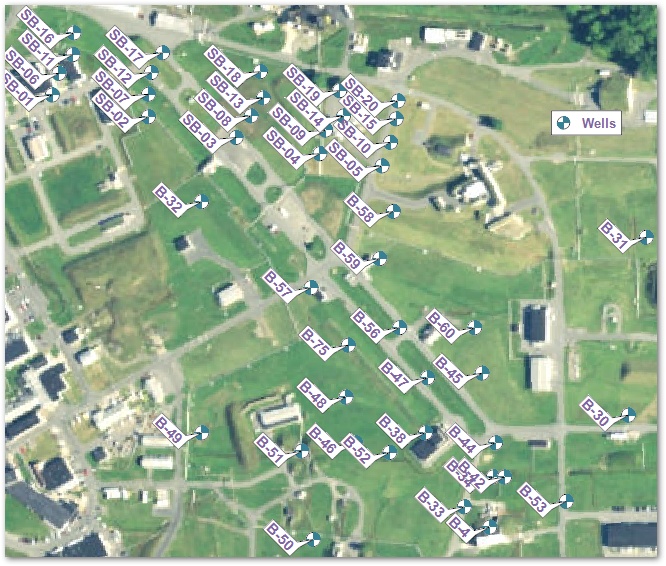
1.Select Plot> 2D Data> Locations.
2.Select the Labels tab and make the desired selections.
For this exercise, change the Font style to Bold, the Label Color to Purple and the height to 12. Set the Rotate by 45 degrees.
3.Select the Options tab and make the desired selections.
For this exercise, change the Radius to 8 and the Fill Color to Turquoise.
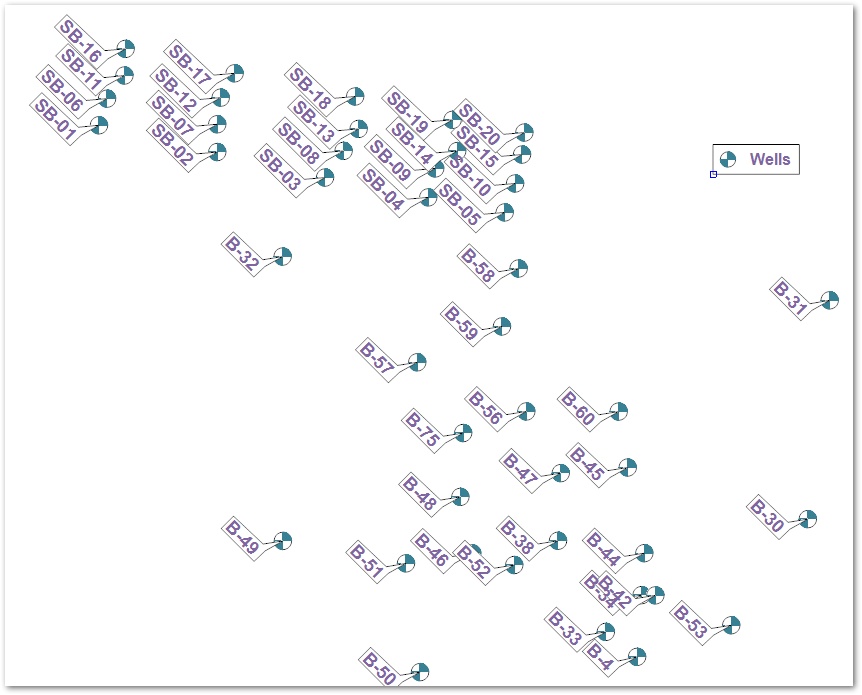
4.Click the OK button. EnviroInsite performs the defined query and plots the locations from the EQuIS facility.
5.Click Zoom Window ![]() to zoom in to the area of interest.
to zoom in to the area of interest.
6.Click Zoom Extent ![]() to see the entire drawing and/or data extents.
to see the entire drawing and/or data extents.
|
Move the cursor around the window and notice that EnviroInsite posts the cursor coordinates near the lower right corner. |
7.Below the map, note the locations are plotted and the location data is displayed in the Data tab of the Work Log.
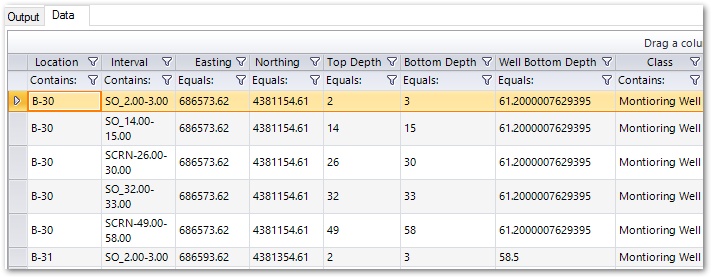
8.Right-click in the header row of the Data grid and select Copy to send the contents of the data grid to the clipboard. Note that creating a new layer will add an icon and label in the Plot Control panel on the left. Layer properties may be modified by right-clicking on the layer labels.
|
Reducing the capture distance may be useful for instances where too many of some plot object are being drawn on a given plan. |
|
Objective: Add ArcGIS Online Basemaps |
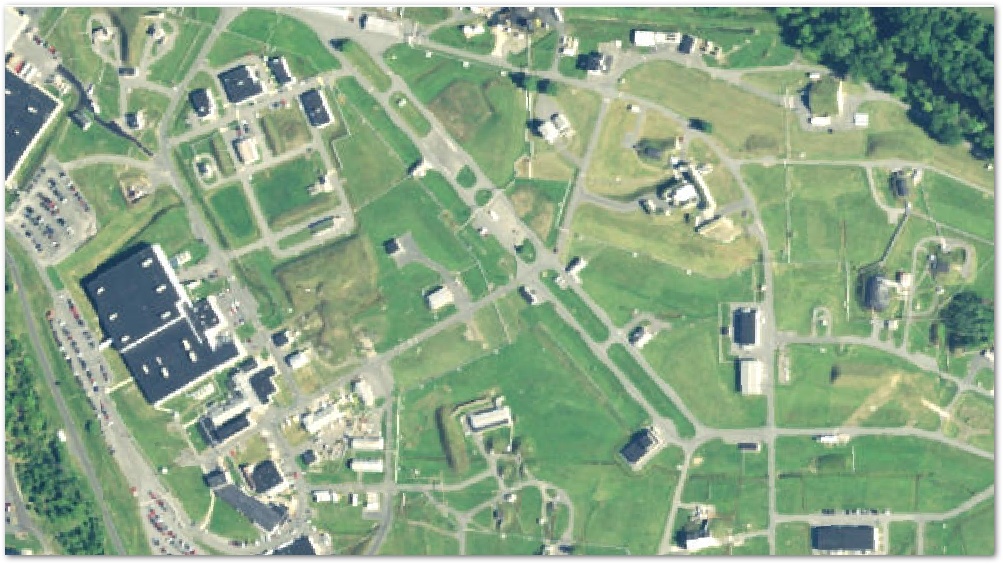
EnviroInsite supports a wide variety of mapping methodologies. Import aerial photos or other maps from ArcGIS Online. Bing Maps may be imported directly for a small fee.
1.Move the cursor around the EnviroInsite window and note the cursor coordinate in the lower right corner of the window. EnviroInsite sets the window coordinates to the bounds of the location data of the EQuIS database.
![]()
2.Select Insert> ArcGIS Online Maps.
3.Accept the default options and then click the OK button.
|
The last item plotted is always drawn on top of the previously plotted items. Change the plot order by selecting an item from the Plot Control panel (at the left) and dragging it to a different position. |
8.Select the ArcGIS World 1 layer in the Plot Control panel and drag it above the Wells 1 layer so the locations are displayed on top of the map.
|
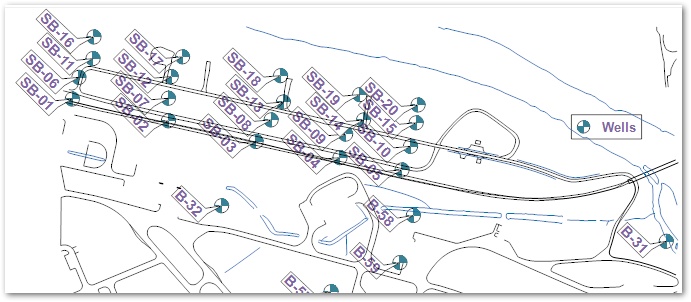
Objective: Import Shapefiles |
Display shapefiles, CAD vector map formats or georeferenced aerial photos in standard raster formats such as tiff, png, jpg, and MrSid.
1.Select Insert from the EnviroInsite Menu and Shapefile.
2.Browse to the desired Shapefile.
For this exercise, browse to the .../roadsarcz.shp shapefile.
3.Make the desired selections, for example, Drape on Surface.
4.Go to the Crop tab and check Crop to Rectangle.
5.Under Options section, select Clip Shapes at Rectangle.
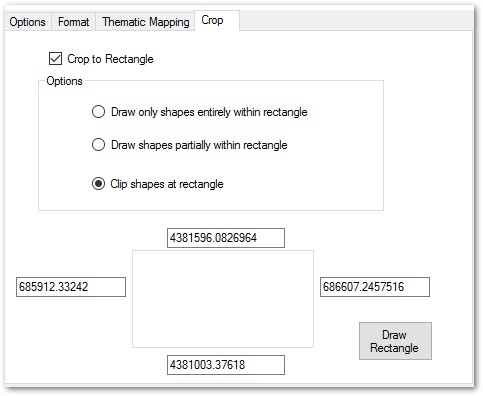
6.Make any other changes to the format and click the OK button.
7.Un-check the ArcGIS World layer in the Plot Control panel so only the Locations and the added shapefile are visible.
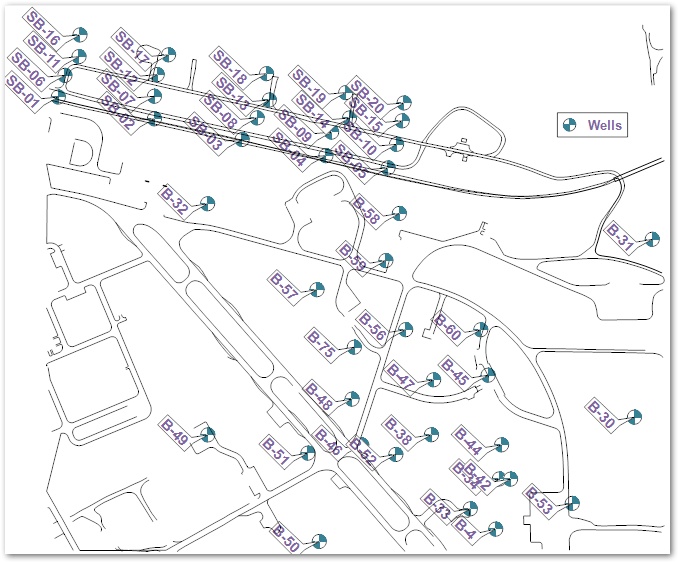
8.Select Insert> Shapefile to insert another Shapefile.
9.Browse to the desired Shapefile.
For this exercise, browse to the .../hydrology.shp shapefile.
10.Check Drape on Surface.
11.Select Crop, check Crop to Rectangle.
12.Under the Options section, select Draw shapes partially within rectangle.
13.Go to the Format tab and select Line Color of blue.
14.Click the OK button.
15. Check the ArcGIS World layer in the Plot Control panel so all the layers are again visible.
|
Objective: Save EnviroInsite Documents |
EnviroInsite documents contain full descriptions of all of the plotted objects, including query parameters and all formatting options. Save work intermittently so it may be re-opened at a later time. Saved document files are .xml files (although by default they are created with a .vizx extension).
1.Select File> Save As. Browse to the project folder and save the file with the desired name.
2.Note from the Work Log at the bottom of the screen that the file saves to the default working folder:
C:\Users\<Username>\Documents\My EnviroInsite Work\insite1.vizx.
|
Whenever a .vizx document is saved over an existing document, a backup of the prior version is saved out with an “.old” extension. |