Overview
Build and format EQuIS reports using the many reporting options available. Create and format crosstab reports to compare two or more variables. Create time series charts to display results and other data over time, and create contour charts to display analytical data or water level elevations over an area.
Exercise Scenario
We need to construct two tabular reports and then build and design four quarterly reports and graphs:
1.A series of time series charts for all of our locations that depict lead concentrations over time.
2.A single time series chart for a particular location that includes the analytical results for lead compared to the Irrigation Water Action Level.
3.A contour chart that shows our most recent manganese results over the site area.
4.A formatted crosstab report that contains quarterly results compared to the Irrigation Water Action Levels.
|
Learn a variety of reporting and analysis options to better understand your project site and make informed decisions. |
|
Exercise Objectives |
•Build and Save Analytical Results II Reports
•Build Action Level Exceedance II Reports with Parameters
•Generate Time Series Charts with Results and Action Levels
•Produce Contour Charts of Concentrations Over an Area
•Design and Format Crosstab Reports
Optional Exercises
•Apply Excel Templates to Crosstab Reports
•Publish Crosstab Reports
Skills, Software and Permissions Required
•EQuIS Professional 7 must be installed on the workstation with the EQuIS Library feature turned on
•.NET Framework 4.7.2 or higher must be installed on the workstation
•Read permissions to the desired facilities are required
•Write permissions to the desired facilities are required to save groups and action levels and publish crosstab reports
|
Objective: Build and Save Analytical Results II Reports |
Tasks
•Build Analytical Results II Reports
•Save Report Parameters as User Reports
Build Analytical Results II Reports
1.If necessary, reconnect to the EQuIS Training Database used in the previous exercise.
2.In EQuIS Professional, select Reports ![]() from the Open group on the Home ribbon.
from the Open group on the Home ribbon.
3.Select Analytical Results II from the list of available reports.
4.Select the Open button.
5.Within the parameter selection screen, click on the ellipsis ![]() to the right of each desired parameter. This will open a selection window on the right pane. Check desired parameters.
to the right of each desired parameter. This will open a selection window on the right pane. Check desired parameters.
For this exercise, select the following parameters:
Parameter |
Selection |
|---|---|
Location> Individual(s) |
4952942 |
Result> Analyte> Individual(s) |
Lead |
|
The parameters can be filtered like other fields in EQuIS Professional. To easily locate the desired parameter, click in the filter column of the desired parameter (e.g., CHEMICAL_NAME) and type the target parameter. |
Save Report Parameters as User Reports
1.Once the parameters have been selected, type the desired report name in the User Reports text box.
For this exercise, enter "Lead Results-Single Location <your initials>".
2.Click the Save ![]() button next to the User Reports text box.
button next to the User Reports text box.
3.Select the OK button when the prompt appears indicating that the report saved.
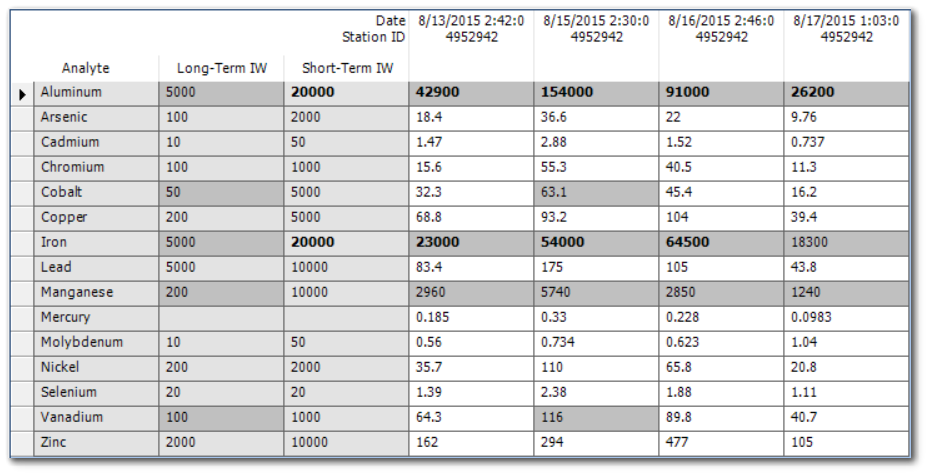
4.Click the Go ![]() button on the toolbar (above User Reports). The results return in grid format.
button on the toolbar (above User Reports). The results return in grid format.
|
Objective: Build Action Level Exceedance Reports |
1.Select Reports ![]() from the Open group on the Home ribbon.
from the Open group on the Home ribbon.
2.Select Action Level Exceedance II with Parameters from the list of available reports.
3.Select the Open button.
4.Within the parameter selection screen, click on the ellipsis ![]() to the right of each desired parameter. This will open a selection window on the right pane. Check desired parameters
to the right of each desired parameter. This will open a selection window on the right pane. Check desired parameters
For this exercise, select the following parameters:
Parameter |
Selection |
|---|---|
Location> Group |
Utah |
Sample> Matrix |
WS |
Result> Analyte> Groups |
Irrigation Water Analytes |
Result> Unit |
ug/L |
Action Levels |
Long-Term Irrigation Waters, Short-Term Irrigation Waters |
5.Save the report parameters to the EQuIS database by naming the report as desired in the User Reports text box and then click the Save ![]() button next to the User Reports text box.
button next to the User Reports text box.
For this exercise, name the report “Quarterly_UT_Irrigation_<your initials>”.
6.Select the OK button when the prompt appears indicating that the report saved.
7.Click the Go ![]() button on the toolbar (above User Reports). The results return in grid format.
button on the toolbar (above User Reports). The results return in grid format.
|
Objective: Generate Time Series Charts with Results and Action Levels |
Tasks
•Create Time Series Charts for Multiple Locations
•Format Time Series Charts
•Add Action Levels to Time Series Charts
Create Time Series Charts for Multiple Locations
1.Select Reports ![]() from the Open group on the Home ribbon.
from the Open group on the Home ribbon.
2.Open an Analytical Results II Report and select the desired parameters.
For this exercise, select the following parameters:
Parameter |
Selection |
|---|---|
Location> Group |
Utah |
Sample> Date Range> End |
12/31/2017 |
Sample> Matrix |
WS |
Test> Fraction |
T |
Result> Analyte> Individual |
Lead |
Result> Unit |
ug/L |
3.Select the Go ![]() button on the toolbar (above User Reports) to run the tabular report.
button on the toolbar (above User Reports) to run the tabular report.
4.Click XY Charts ![]() on the toolbar.
on the toolbar.
5.In the Data pane, select Group Charts By: SYS_LOC_CODE and leave all selections set to their defaults.
6.Select Add Series ![]() on the toolbar in the Data pane.
on the toolbar in the Data pane.
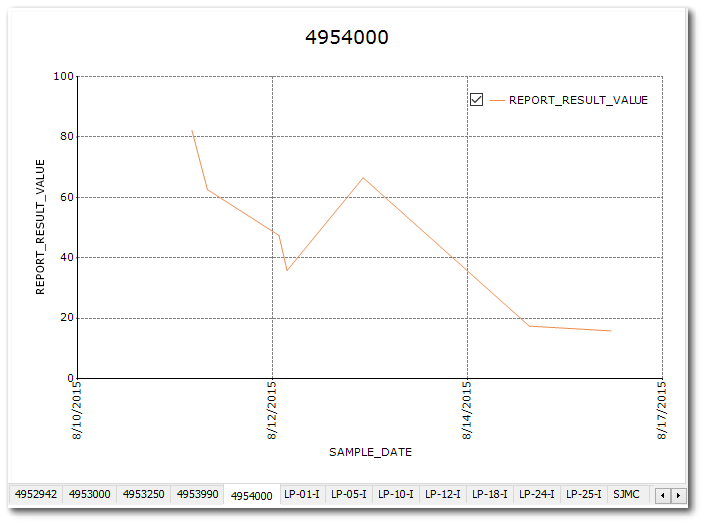
7.Single-click on any of the chart tabs at the bottom of the chart to view the results for different locations.
For this exercise, select and view the 4954000 chart tab.
Format Time Series Charts
Change the Y-Axis Title
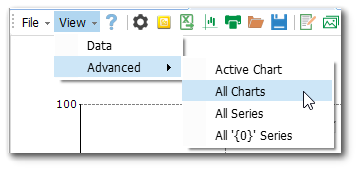
1.In the toolbar in the top left of the workspace, select the View menu, Advanced> All Charts. This will display the Advanced tab for all charts.
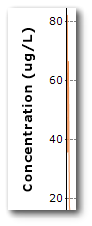
2.Scroll to the Axes section and expand the PrimaryYAxis node.
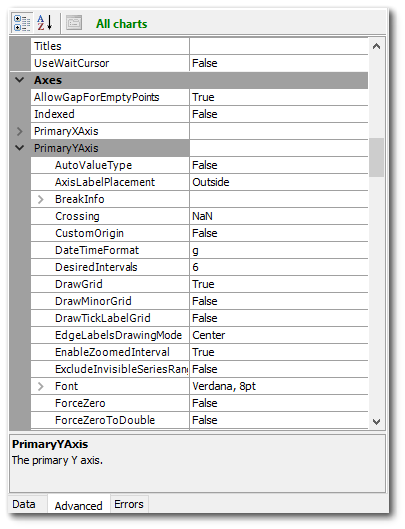
3.Locate the Title field and type "Concentration (ug/L)".
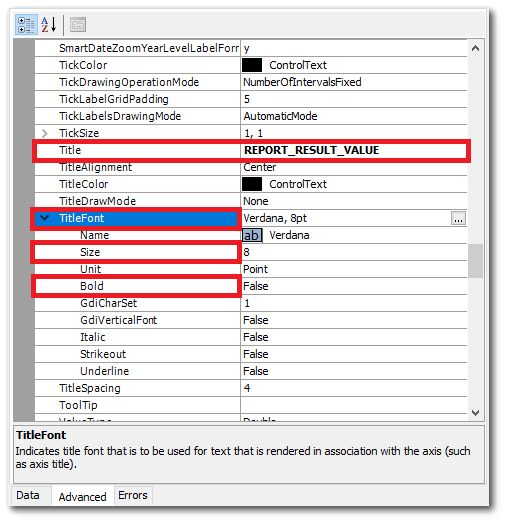
1.Expand the TitleFont node. 2.Set the Bold field to True and in the Size field, enter "10". 3.Place the cursor in another field and note how the Y-axis title has updated. |
|
Changing the X-Axis Title and Format
1.Return to the Axes node in the Advanced tab, collapse the PrimaryYAxis node and then expand the PrimaryXAxis node.
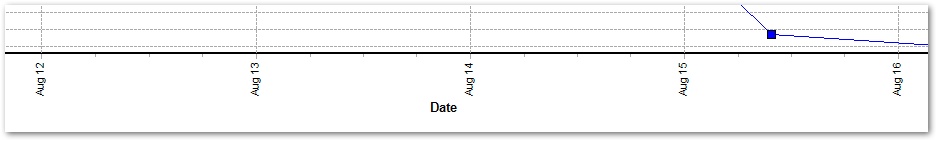
2.In the Title field, type "Date".
3.Expand the TitleFont node.
4.Set the Bold field to True and in the Size field, enter "10".
5.Find the DateTimeFormat field.
6.Enter "MMM dd".
7.Collapse the Labels node and find the Increment field.
8.Change the Increment to 1 (for one day).
9.Place the cursor in another field and note the X-axis and labels have updated.
Change the Font of the Title
1.Collapse the Axes node.
2.Under the Titles group heading, expand the Header node.
3.Expand the Font node and set the Bold field to True.
4.In the Size field, enter "12". Note that the location name has updated.
Save the Chart Template
1.From the XY Chart toolbar, select Save Template ![]() .
.
2.Name the template as desired and select the Save button.
Change the Series Title in the Legend
1.Right-click anywhere in the white space of the chart and select Advanced> All Series.
2.Select the Advanced tab from the bottom of the Data pane.
3.In the Text field, enter the desired series title.
For this exercise, enter "Lead" as the series title.
Select another field in the Advanced tab and note that the series title in the legend has updated. |
|
Export the Charts to Excel
1.Select Excel ![]() from the XY Chart toolbar.
from the XY Chart toolbar.
2.Name the file as desired and select the Save button. All of the created charts will automatically export to Excel.
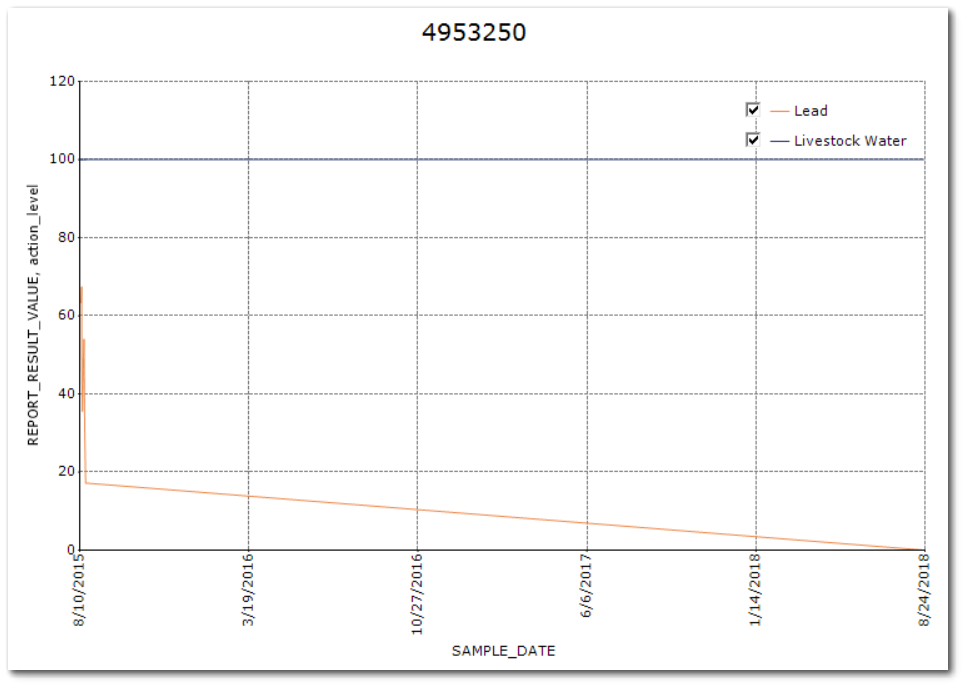
Add Action Levels to Time Series Charts
1.Select Reports ![]() from the Open group on the Home ribbon.
from the Open group on the Home ribbon.
2.Open an Action Level Exceedance II with Parameters Report and select the desired parameters.
For this exercise, select the following parameters:
Parameter |
Selection |
|---|---|
Location> Individual |
4953250 |
Sample> Matrix |
WS |
Test> Fraction |
T |
Result> Analyte> Individual |
Lead |
Result> Unit |
ug/L |
Action Level |
Livestock Water |
3.Select the Go ![]() button on the toolbar (above User Reports) to run the tabular report.
button on the toolbar (above User Reports) to run the tabular report.
4.Click XY Charts ![]() on the toolbar.
on the toolbar.
5.Select Group Series By: CHEMICAL_NAME and leave all selections set to their defaults.
6.In the Data pane, select Group Charts By: SYS_LOC_CODE.
7.Select Add Series ![]() on the toolbar in the Data pane.
on the toolbar in the Data pane.
8.In the Data pane, change Y-Axis to ACTION_LEVEL.
9.Change Group Series By to ACTION_LEVEL_CODE.
10.Select Add Series ![]() on the toolbar in the Data pane.
on the toolbar in the Data pane.
|
If needed, use the Advanced tab of the XY Chart to make changes to the formatting. For example, increase the left axis maximum to better display all of the data. |
|
Objective: Produce Contour Charts of Concentrations Over an Area |
Create different styles of XYZ Charts from an Analytical Results report to display data over an area.
Tasks
•Create Contour Charts
•Create Color Grids
•Create 3D Surface Plots
Create Contour Charts
1.Click Reports ![]() from the Open group on the Home ribbon.
from the Open group on the Home ribbon.
2.Select the Analytical Results II report and click the Open button.
3.From the Data pane, select the desired parameters.
For this exercise, select the following parameters:
Parameter |
Selection |
|---|---|
Location> Group(s) |
Utah |
Sample> Date Range> Most Recent Sampling |
Check box |
Sample> Matrix |
WS |
Test> Fraction |
T |
Result> Analyte> Individual |
7439-96-5 (Manganese) |
Result> Unit |
ug/L |
4.Select the Go ![]() button on the toolbar (above User Reports) to run the report and view the designed report.
button on the toolbar (above User Reports) to run the report and view the designed report.
5.Select XYZ Chart ![]() on the toolbar.
on the toolbar.
6.From the Data pane, set the desired parameters to be contoured. By default, the X_COORD and Y_COORD will be set as the X and Y values, respectively.
For this exercise, set the Label to SYS_LOC_CODE, and accept the other defaults.
7.Select Contour ![]() on the Data pane toolbar.
on the Data pane toolbar.
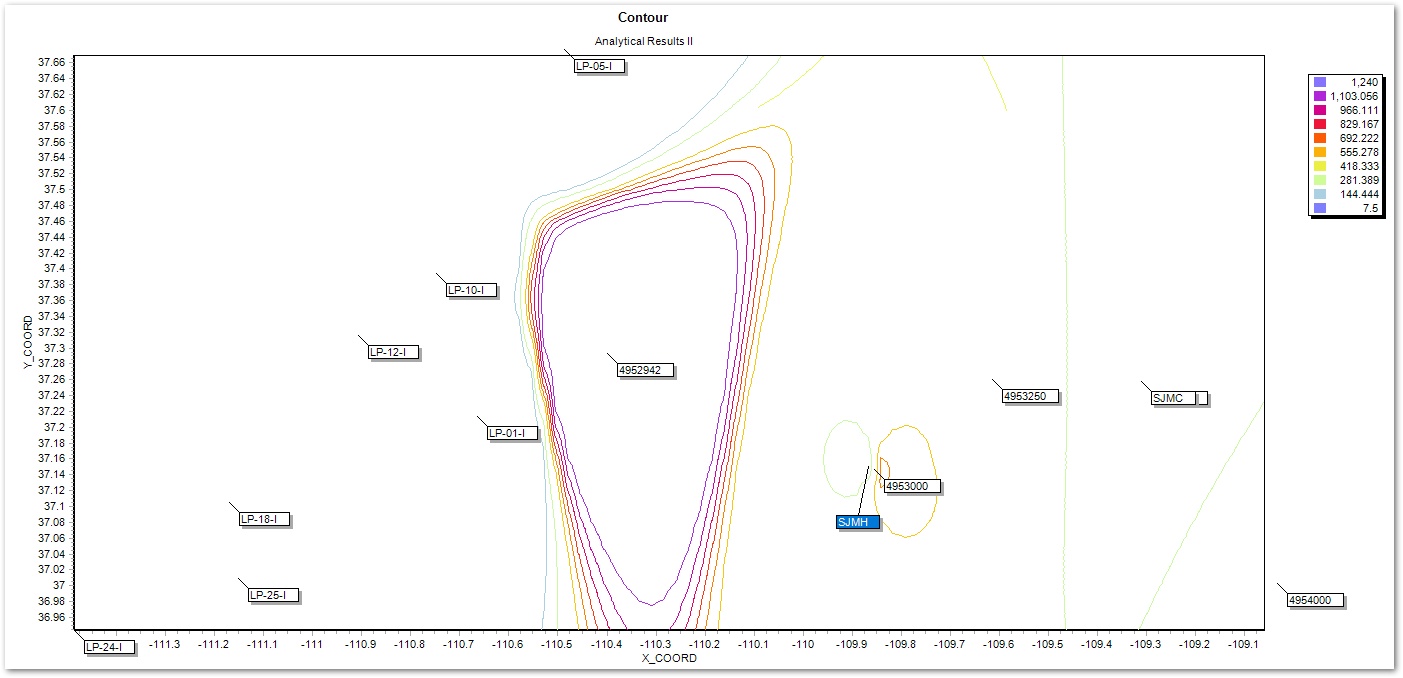
A contour chart is displayed that depicts the three different variables: the X-Coordinate, the
Y-Coordinate and the Report Result Value.
Create Color Grids
1.Select Clear ![]() from the Data pane toolbar.
from the Data pane toolbar.
2.Set the Label parameter to (None) and then select Color Grid ![]() from the Data pane toolbar.
from the Data pane toolbar.
3.Enhance the color grid’s appearance, as desired, using the Advanced tab.
Create 3D Surface Plots
1.Select Clear ![]() from the Data pane toolbar.
from the Data pane toolbar.
2.Select Surface Plot ![]() to create a 3D Contour of the groundwater elevation data.
to create a 3D Contour of the groundwater elevation data.
3.Single-click and drag the surface plot to a different angle to view the plot more easily.
|
Objective: Design and Format Crosstab Reports |
Crosstab reports are an EQuIS tool that enables the reorganization and summary of data into an easier-to-understand format with column headers, row headers and tabbed data. A crosstab report does not change the data in the EQuIS database. For this exercise, a general overview of the steps needed to create and design a crosstab report will be presented prior to working with the EQuIS training database and following step-by-step instructions.
For this exercise, create a formatted crosstab report that contains quarterly results compared to the Irrigation Water Action Levels.
1.Build the desired tabular report, or load a previously saved User Report:
a.Select Reports ![]() from the Home ribbon and open the desired tabular report.
from the Home ribbon and open the desired tabular report.
For this exercise, select and open the Action Level Exceedance II with Parameters tabular report.
b.From the User Reports drop-down on the report toolbar, select the desired User Report.
For this exercise, load the Quarterly_UT_Irrigation_<your initials> user report if previously generated, or select parameters, as described in the "Build Action Level Exceedance Reports" portion of this chapter.
2.Select Go ![]() to run the tabular report.
to run the tabular report.
3.Select Crosstab ![]() on the report toolbar.
on the report toolbar.
4.Drag and drop the desired fields from the Available Columns pane into the available panes for column headers, row headers, and tabbed data.
For this exercise, drag and drop the following fields from the Available Columns pane to the appropriate panes in the crosstab configuration.
Configuration Pane |
Selection |
|---|---|
Column Headers |
SAMPLE_DATE, SYS_LOC_CODE |
Row Headers |
CHEMICAL_NAME, |
Tabbed Data |
REPORT_RESULT_TEXT |
5.Select Go ![]() on the Crosstab toolbar to run the Crosstab report and view the designed report.
on the Crosstab toolbar to run the Crosstab report and view the designed report.
6.Select Back ![]() on the Crosstab toolbar to return to the Crosstab configuration panes as needed.
on the Crosstab toolbar to return to the Crosstab configuration panes as needed.
|
The order that the fields are listed in the Row Header, Column Header or Tabbed Data panes establishes the order they are presented in the crosstab report. Fields can be reordered by clicking on a field and dragging it to the desired position. |
7.In the corresponding Caption fields in the Column Header, Row Headers and Tabbed Data panes, insert the desired captions.
For this exercise, enter the following captions:
Column Name |
Caption |
|---|---|
SAMPLE_DATE |
Date |
SYS_LOC_CODE |
Station ID |
CHEMICAL_NAME |
Analyte |
LONG-TERM IRRIGATION WATERS_ACTION_LEVEL |
Long-Term IW |
SHORT-TERM IRRIGATION WATERS_ACTION_LEVEL |
Short-Term IW |
REPORT_RESULT_TEXT |
<enter a space> |
8.Under Options, select Separate tables by each unique: and choose SYS_LOC_CODE from the drop-down menu.
9.Select Go ![]() on the Crosstab toolbar to view the crosstab, now separated into unique tabs by SYS_LOC_CODE.
on the Crosstab toolbar to view the crosstab, now separated into unique tabs by SYS_LOC_CODE.
10.Select Back ![]() on the Crosstab toolbar to return to the Crosstab configuration panes.
on the Crosstab toolbar to return to the Crosstab configuration panes.
11.In the Row Headers pane, select the Display drop-down menu for one of the action levels, and select Exceedance (custom). It may be necessary to scroll to the right in the Row Header(s) quadrant to view the Display column.
12.Single-click on the Background Color dropdown, click the Web tab, and set to Silver.
13.Select the OK button.
14.In the Row Headers pane, select the Display drop-down menu for the other action level, and select Exceedance (bold).
15.Click Save ![]() on the Crosstab toolbar, and name and save the configuration. This will save a local .xml file with the crosstab configurations. As this file is saved to an individual machine, it is not available for other users to access and run.
on the Crosstab toolbar, and name and save the configuration. This will save a local .xml file with the crosstab configurations. As this file is saved to an individual machine, it is not available for other users to access and run.
16.Select Go ![]() on the Crosstab toolbar to run the report.
on the Crosstab toolbar to run the report.
17.From the location tabs at the bottom of the screen, select a specific tab to view data for that location.
|
Optional Exercise: Apply Excel Templates to Crosstab Reports |
Export a crosstab report to Microsoft Excel using the Excel template feature. This feature allows customized headers, footers, and company branding in the output to be automatically included. This formatting will apply to all the pages in the export.
1.Select Back ![]() on the Crosstab toolbar to return to the Crosstab configuration panes established in the previous exercise.
on the Crosstab toolbar to return to the Crosstab configuration panes established in the previous exercise.
2.Under Options, place a check in the box Use Excel Template to associate the drop-down box.
3.Select the drop-down arrow and choose the desired Excel template (assuming it's already been published to the EQuIS database).
For this exercise, select the “Crosstab_Example_ELM” Microsoft Excel template.
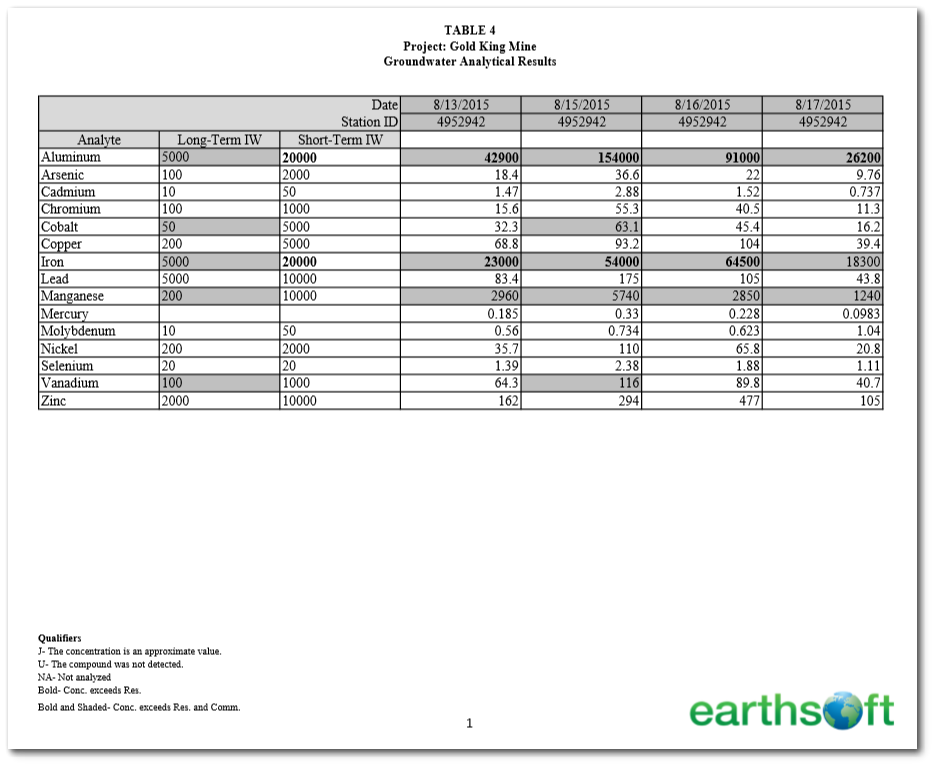
4.In the Crosstab configuration screen, select Go ![]() to run the report. The Crosstab report produced in EQuIS Professional will not contain any evidence of the Excel template at this stage.
to run the report. The Crosstab report produced in EQuIS Professional will not contain any evidence of the Excel template at this stage.
5.Export the template to Microsoft Excel by selecting the Excel ![]() icon on the Crosstab toolbar.
icon on the Crosstab toolbar.
6.Save the Excel workbook and then MS Excel will automatically open and display the report with the template applied.
|
Optional Exercise: Publish Crosstab Reports |
1.Select Back ![]() on the Crosstab toolbar to return to the Crosstab configuration panes established in the previous exercise.
on the Crosstab toolbar to return to the Crosstab configuration panes established in the previous exercise.
2.Select Publish ![]() on the Crosstab toolbar to publish the Crosstab configuration (including the MS Excel template) to the EQuIS database.
on the Crosstab toolbar to publish the Crosstab configuration (including the MS Excel template) to the EQuIS database.
3.In the Publish Report window, enter the desired name for the published report, such as “Irrigation Report-<your initials>” for the name.
4.Change the Parameters drop-down to Show All Input Parameters.
5.Select the Finish> button.
6.Select OK on the Publish Report dialog box which confirms that the report has been published.
7.Select Reports ![]() from the Open group on the Home ribbon.
from the Open group on the Home ribbon.
8.Select Refresh ![]() from the top-left corner of the Reports window. Note that the previously published report is now available in the report list.
from the top-left corner of the Reports window. Note that the previously published report is now available in the report list.
9.Single-click to highlight the published report and select Open.
10.Select the desired parameters.
11.For the Output Format, select .xls.
12.Select Go ![]() on the Crosstab toolbar. The report will generate and automatically open in MS Excel.
on the Crosstab toolbar. The report will generate and automatically open in MS Excel.