Introduction to EQuIS Professional
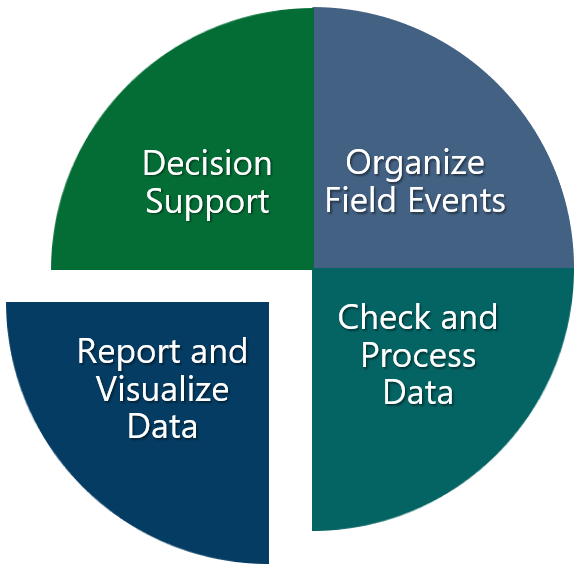
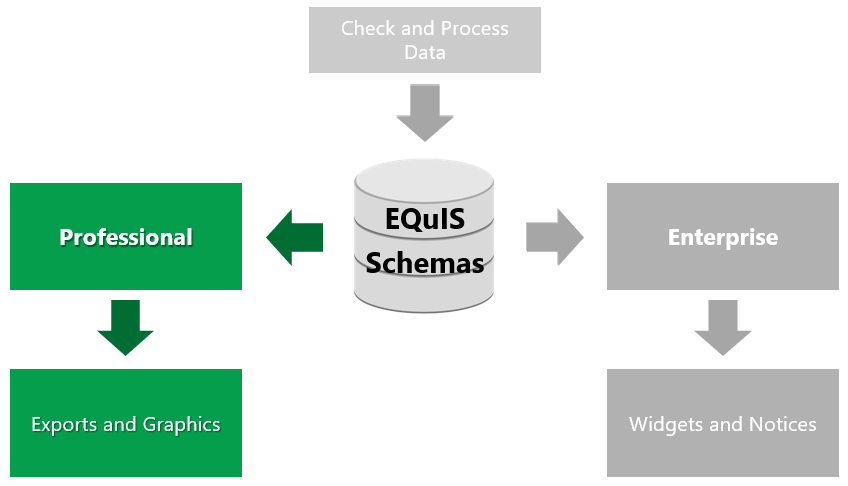
EQuIS Professional is part of the EQuIS environmental data management workflow and is used to manage, analyze, and report data. Several tools are available to view and manage raw data in the tables. Create tables, graphs, and maps for reporting data, such as contamination plumes and groundwater gradients. Advanced, formatted, print-ready reports can be developed. Report, graph, and export data to a variety of templates and other applications.
|
|
EQuIS Professional Interface
The EQuIS Professional interface consists of the main EQuIS menu, a series of ribbons to access various components of EQuIS Professional, and a workspace. The ribbon tabs are organized around specific actions or tools, such as graphic programs and modeling software. The Home Ribbon is the main landing spot when logging into EQuIS Professional, and includes the Import, Edit, Open, and Graphic Tools groups as well as links to help and other EarthSoft applications.
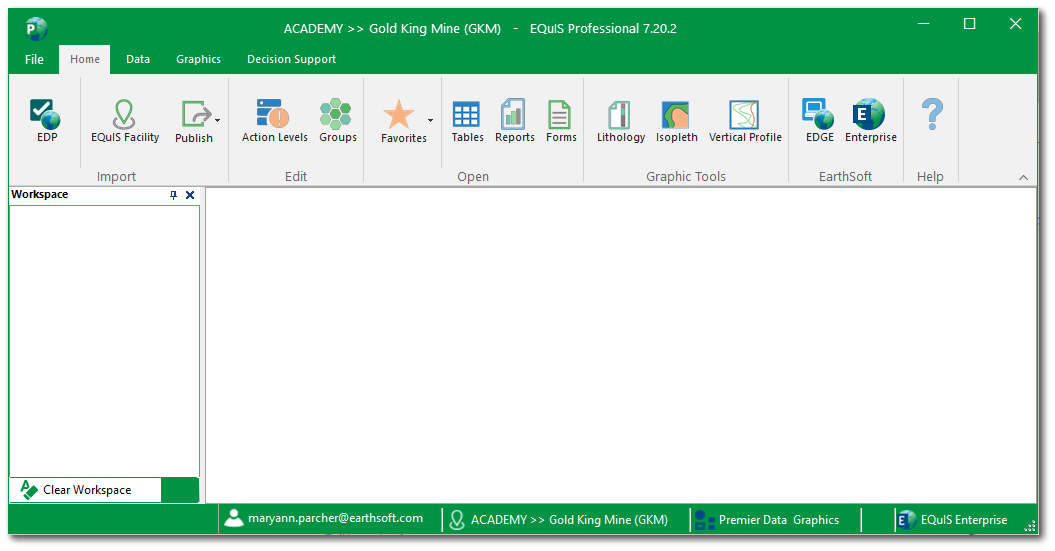
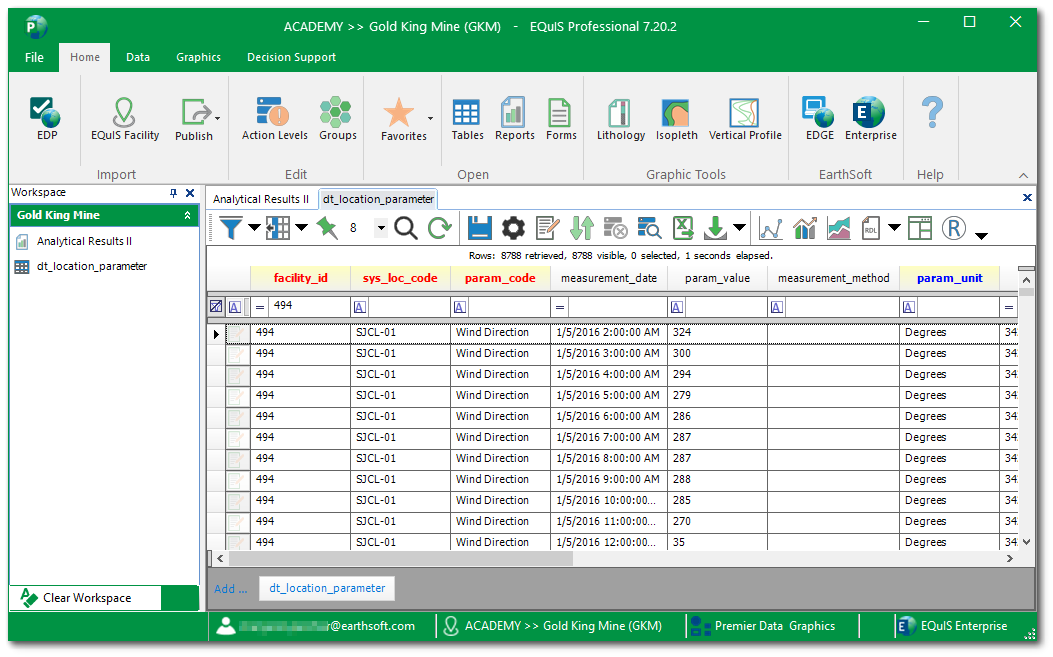
As tables, reports, etc. are opened, the items are added to the workspace as tabs. The items are also displayed in the left workspace pane.
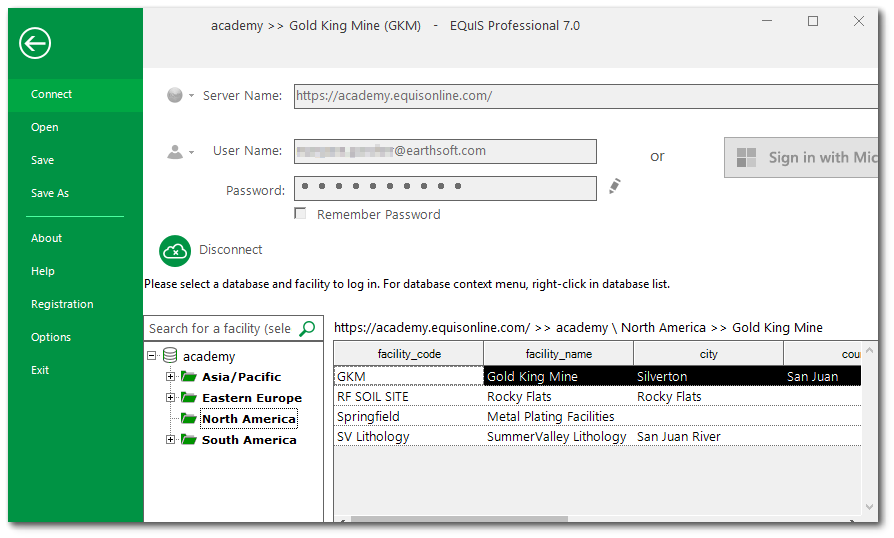
To access the main EQuIS menu on the application backstage, either select the File tab. The main menu will open and allow the user to:
•Connect to an EQuIS database;
•Open an existing, saved database/facility/facility group connection;
•Save or create a new EQuIS database connection;
•Register different components of the EQuIS Professional application as well as renew maintenance;
•Display the version of EQuIS Professional as well as the version of the different *.dlls associated with the installation of EQuIS Professional by selecting the About button; and
•Customize several options, including general program defaults, behavior, export options, and working directories.
Key Terminology
Data Tables – Data tables contain information acquired from, derived from, or describing some part of a specific project (i.e., facility). These tables include a wide variety of chemistry, geology, hydrology, limnology, and geotechnical data. Data tables are designated by the prefix DT_ (e.g., DT_SAMPLE).
Reference Tables – Reference tables contain lists of reference values, valid values, or look-up values. The values include lists of units, coordinate types, analytes, CAS numbers, matrices, analytical methods, etc. These values are typically defined at the beginning of a project by the project administrator(s). Reference tables are designated by the prefix RT_ (e.g., RT_ANALYTE). Reference values are frequently provided in EQuIS applications as pull-down lists. Requiring selection from a list (rather than open text entry) ensures consistency in spelling, which ensures consistency in data. Reference tables apply to ALL facilities within a database.
Crosstab Reports – Crosstab reports are an EQuIS tool that enables the reorganization and summary of data into an easier-to-understand format with column headers, row headers and tabbed data in a tabular format. A crosstab report does not change the data in the EQuIS database.
Groups – The collection of multiple individual analytes, locations, materials, sub-facilities and/or facilities. Used primarily for reports and for planning sampling tasks using EQuIS SPM.
Action Levels – Values against which analytical results or parameter measurements are compared to when reporting in EQuIS. Action levels may also be referred to as standards, comparison criteria, cleanup levels, etc.
EQuIS Table Conventions
The column headers in EQuIS tables contain the data field names from the associated database Schema. To help understand data connections and assist with data population, criteria for certain fields are denoted by the following conventions:
•Red and Underlined text indicates a Primary Key field.
•Red text indicates a required field.
•Blue text indicates a field linked to a Reference table (e.g., look-up or valid value).
Training Scenario Overview
We will be working with data collected for the Gold King Mine facility. Located approximately 10 miles north of Silverton, CO, the Gold King Mine Site was claimed in 1887 and was last active in the 1920s. Mining activities produced acid mine drainage that required monitoring to avoid contamination of the nearby Animas River.
In August 2015, approximately three million gallons of mine waste were accidentally released into Cement Creek, a tributary of the Animas River. The spill contained known contaminants of arsenic, cadmium, copper, lead, and aluminum. The spill changed the color of the river to orange. The post-spill monitoring includes surface water, soil and sediment to measure impact of the spill on the greater San Juan River.
Using EQuIS professional, we need to analyze the data to determine the impact on the river. To facilitate data analysis, we will build location and analyte groups, setup action levels to compare to our data, construct tabular reports, build and design quarterly reports, and create a variety of charts.