Overview
Export data from EQuIS directly into Google Earth using EQuIS for Google Earth if both EQuIS Professional and Google Earth are installed on the workstation. If Google Earth is not installed, export data out of EQuIS as .kmz files, which may be opened separately.
Exercise Scenario
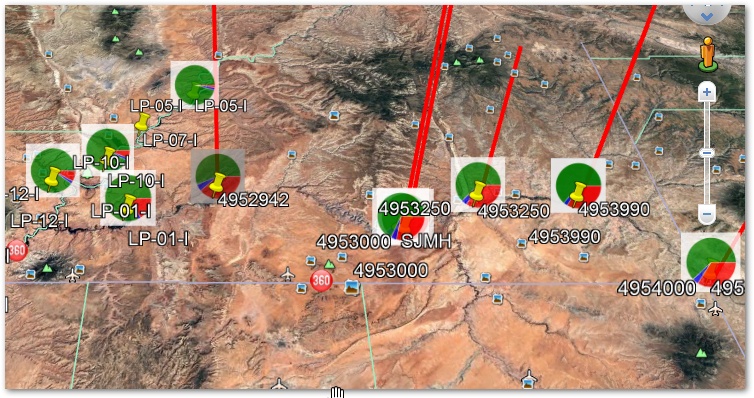
We are ready to do some more advanced analysis on our data. First, we want to plot our locations in Google Earth. We then need to add three types of layers to our map to display the results. We want to build the following layers:
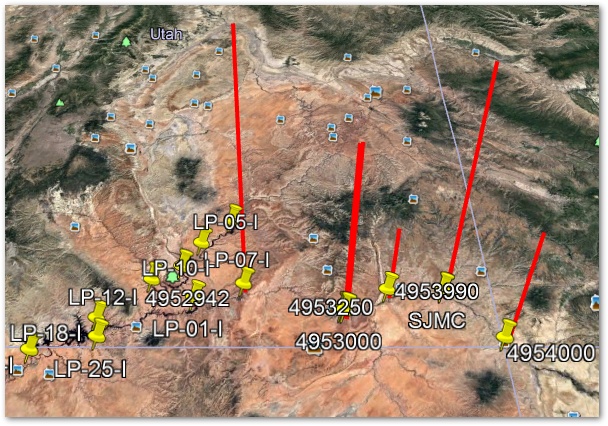
•A layer that displays relative concentrations as three-dimensional cylinders of an analyte.
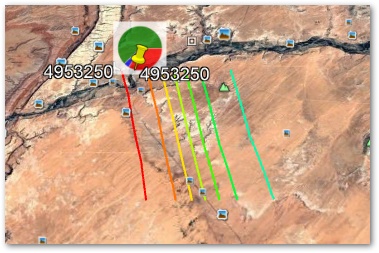
•A layer with contours of concentrations of an analyte at a specific date.
•A pie chart layer that shows the concentrations of multiple analytes relative to each other.
|
Exercise Objectives |
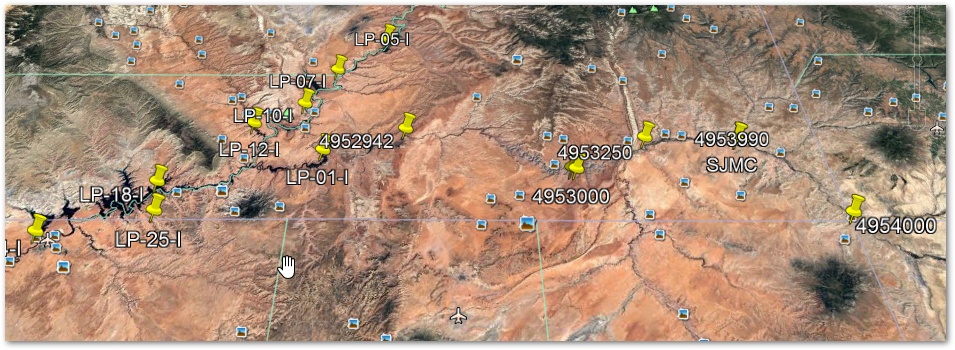
•Plot EQuIS Locations in Google Earth
•Add 3D Cylinders to Google Earth
•Add Pie Charts to Google Earth
•Plot Contours in Google Earth
Skills, Software and Permissions Required
•EQuIS Professional v6.0 or higher must be installed on the workstation
•.NET Framework 4.0 or higher must be installed on the workstation
•Read permissions are required for the desired facilities
•Most recent version of Google Earth should be installed on the workstation
|
Objective: Plot EQuIS Locations in Google Earth |
1.Open the Windows Start menu and choose All Programs> EarthSoft> EQuIS Professional.
2.Expand the desired connection under My Connections.
For this exercise, select the Training connection.
3.Expand the desired EQuIS database.
For this exercise, expand the SummerValley database.
4.Single-click the Facility name from the facility list that appears (expand Facility Group folders as needed) and double-click on the desired License Library to log into the facility.
For this exercise, expand the North America folder and double-click on the Gold King Mine facility.
5.The main EQuIS Professional window opens.
6.Select the GIS ribbon.
7.View the Google Earth reports available on the GIS ribbon.
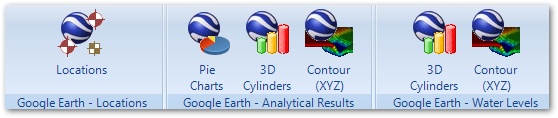
8.Select Locations from the Google Earth - Locations group of the GIS ribbon.
9.Click on the ellipse ![]() to the right of each desired parameter and select the desired parameters.
to the right of each desired parameter and select the desired parameters.
For this exercise, select the following parameters:
Parameter |
Selection |
|---|---|
Location Group |
Utah |
Description |
LOC_DESC |
Name on Map |
SYS_LOC_CODE |
10.Click Go ![]() above User Reports to run the report. If Google Earth is installed, the results will automatically export to Google Earth.
above User Reports to run the report. If Google Earth is installed, the results will automatically export to Google Earth.
|
Objective: Add 3D Cylinders to Google Earth |
1.Return to EQuIS Professional
2.Select 3D Cylinders from the Google Earth - Analytical Results group of the GIS ribbon.
3.Select the desired parameters.
For this exercise, select the following parameters:
Parameter |
Selection |
|---|---|
Saved Analytical Results Report |
AR: GKM Utah – WS|Alum Only |
4.To run the report, click Go ![]() above User Reports. If Google Earth is installed, the results will automatically export to Google Earth.
above User Reports. If Google Earth is installed, the results will automatically export to Google Earth.
|
Objective: Add Pie Charts to Google Earth |
1.Return to EQuIS Professional.
2.Select Pie Charts from the Google Earth - Analytical Results group of the GIS ribbon.
3.Select the desired parameters.
For this exercise, select the following parameters:
Parameter |
Selection |
|---|---|
Saved Analytical Results Report |
GKM Utah – WS|CD HG SE Only |
4.To run the report, click Go ![]() above User Reports. If Google Earth is installed, the results will automatically export to Google Earth.
above User Reports. If Google Earth is installed, the results will automatically export to Google Earth.
|
Objective: Plot Contours in Google Earth |
1.Return to EQuIS Professional.
2.Select Contours (XYZ) from the Google Earth - Analytical Results group of the GIS ribbon.
3.Select the desired parameters.
For this exercise, select the following parameters:
Parameter |
Selection |
|---|---|
Saved Analytical Results Report |
AR: GKM Utah – WS|Alum Only |
4.To run the report, click Go ![]() above User Reports. If Google Earth is installed, the results will automatically export to Google Earth.
above User Reports. If Google Earth is installed, the results will automatically export to Google Earth.