Overview
EarthSoft's EQuIS for AutoCAD is an interface for AutoDesk’s AutoCAD desktop application that allows users to query and map locations and environmental data information found in an EQuIS database. The EQuIS for AutoCAD interface is ideal for displaying and effectively communicating project information.
To use EQuIS for AutoCAD, the following fields must be populated in EQuIS Professional with corresponding values (e.g., the IDENTIFIER and COORD_TYPE_CODE fields in DT_FACILITY and DT_COORDINATE have to match and be populated):
•DT_FACILITY.COORD_TYPE_CODE
•DT_FACILITY.IDENTIFIER
•DT_COORDINATE.COORD_TYPE_CODE
•DT_COORDINATE.IDENTIFIER
|
To determine if these fields have been populated properly, launch EQuIS Professional and view the location toolbar at the bottom of the screen. If this toolbar is not populated, the fields listed above have not been populated properly. |
Exercise Scenario
Now that our data is in EQuIS, we need to plot our Gold King Mine locations and spider diagrams depicting our results and action levels in AutoCAD to add to other drawing files.
|
Exercise Objectives |
•Launch the EQuIS for AutoCAD Interface
•Plot EQuIS Locations in AutoCAD
•Design and Plot Spider Diagrams
Optional Exercise
•View and Create Location Block Types
Skills, Software and Permissions Required
•EQuIS Professional v6.6 or higher installed on the workstation
•.NET Framework v4.0 or higher installed on the workstation
•AutoCAD 2016 or higher installed on the workstation
•EQuIS for AutoCAD v6.6 or higher installed on the workstation
•Access to the Premier Graphics, Premier Data & Graphics or Ultimate EQuIS Professional Library
•Read permissions are needed for exporting EQuIS data using the AutoCAD interface for the desired facilities
•Proficiency with EQuIS Professional Crosstab reports is recommended—see the Crosstab Reports exercise for additional practice
|
Objective: Launch the EQuIS for AutoCAD Interface |
Launch the EQuIS for AutoCAD Interface directly within AutoCAD.
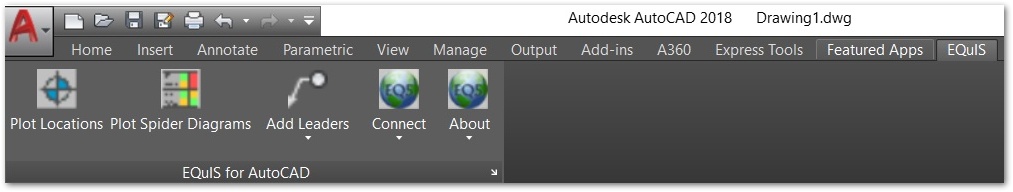
1.Select Start> AutoCAD. If the EQuIS for AutoCAD interface is installed and licensed, the EQuIS toolbar will load and appear at the top of the screen.
|
After an EQuIS for AutoCAD installation, if the EQuIS tab is not appearing in AutoCAD, the following steps will load the tab manually: 1.Type 'cuiload' in the AutoCAD command prompt to open the Customizations Manger. 2.In the menu that appears, remove any existing EQuISCAD customization groups. 3.Next, select Browse and navigate to C:\Program Files\EarthSoft\EQuIS for AutoCAD and select the cuix file there. 4.Select Load to reload the EQuIS tab in AutoCAD. |
2.Select Connect from the EQuIS ribbon.
3.Expand the desired connection under My Connections.
For this exercise, select the Training connection.
4.Expand the desired EQuIS database.
For this exercise, expand the SummerValley database.
5.Single-click the Facility name from the facility list that appears (expand Facility Group folders as needed) and double-click on the desired License Library to log into the facility.
For this exercise, expand the North America folder and double-click on the Gold King Mine facility.
|
Alternatively, launch the AutoCAD interface from within EQuIS Professional. Launch EQuIS Professional and login to the facility of interest. Select the CAD ribbon and then select |
|
Objective: Plot EQuIS Locations in AutoCAD |
Plot any or all of the locations from an EQuIS facility within AutoCAD. Plot in a completely blank .dwg file, or add locations to other layers already in AutoCAD that have the same spatial reference as defined in EQuIS Professional.
Tasks
•Plot All Locations
•Plot Groups of Locations
Plot All Locations
1.Select Plot Locations ![]() from the EQuIS for AutoCAD ribbon.
from the EQuIS for AutoCAD ribbon.
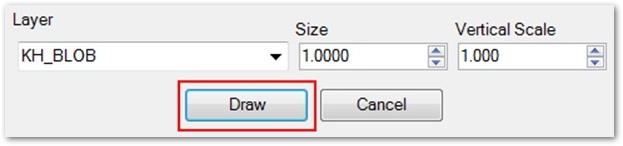
2.The Locations dialog box will open. The parameter selections in this dialog are discussed in the next section below. For this exercise, select the Draw button.
3.Select Go ![]() on the parameter selection screen that opens to plot all the locations.
on the parameter selection screen that opens to plot all the locations.
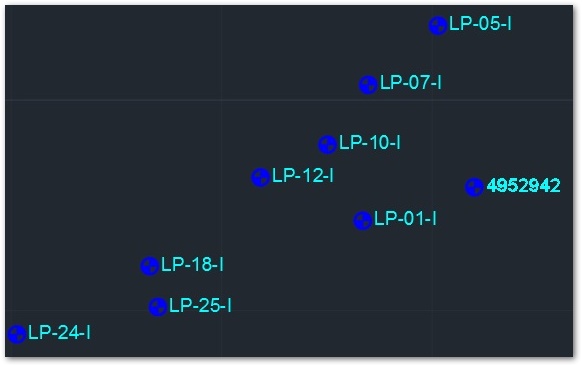
4.Zoom to Extents as desired to see the newly plotted locations. Select the zoom Extents button on the View ribbon or by typing ‘Z’>’E’ in the AutoCAD command prompt.
5.Locations will be plotted in the spatial reference defined in DT_FACILITY in EQuIS Professional. Return to EQuIS Professional to change the coordinate system and identifier as necessary.
Plot Groups of Locations
Select and plot a particular location, several locations, or pre-defined location groups. The location symbol size and scale may also be adjusted with this interface.
1.Erase the locations plotted previously. Click and drag the cursor to highlight all locations, then either right-click and select Erase or simply press the Delete key on the keyboard.
2.From the EQuIS for AutoCAD toolbar, select Plot Locations ![]() . The Locations dialog box will open.
. The Locations dialog box will open.
3.Set the Size to 0.10 to specify the size of the location symbols.
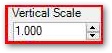
4.Set the Vertical Scale to 1.0 to increase the vertical exaggeration of the location symbols.
5.Select one or more Location> Groups on the parameter selection screen.
For this exercise, select Utah to plot only the locations that belong to the Gold King Mine Utah group.
6.Select Go ![]() to plot to the locations.
to plot to the locations.
|
Objective: Design and Plot Spider Diagrams |
In the EQuIS for AutoCAD Interface, plot location-specific Crosstab tables, or Spider Diagrams. First, design the Spider Diagram as a Crosstab report in EQuIS Professional that is published to the EQuIS database. The published Crosstab can then be selected and plotted within AutoCAD.
Tasks
•Design Spider Diagrams in EQuIS Professional
•Plot Spider Diagrams in AutoCAD
•Add Leader Lines to Spider Diagrams
Design Spider Diagrams in EQuIS Professional
1.Leave AutoCAD open, and return to (or launch) EQuIS Professional.
2.Select Reports from the Open group of the Home ribbon.
3.Browse to and open the Analytical Results Report.
For this exercise, open the System Reports folder, and then open the Analytical Results report.
4.Choose the desired output parameters.
For this exercise, choose the following parameters:
Parameter |
Selection |
|---|---|
Location> Individual(s) |
4952942, 4953000 |
Sample> Type(s) |
N |
Sample> Matrix(es) |
WS |
Test> Fraction(s) |
T |
Result> Analyte> Individual(s) |
Aluminum, Iron, Manganese |
Result> Unit |
mg/L |
5.Name this report as desired in User Reports.
For this exercise, name the User Report as "AR-GKM-Al-Iron-Mn-Total_[your initials]".
6.Save ![]() the User Report.
the User Report.
7.Select Reports.
8.Open the Action Level Exceedance Report.
9.Choose the desired output parameters, using the previously saved Analytical Results User Reports.
For this exercise, choose the following parameters:
Configuration Pane |
Parameter |
|---|---|
Saved Analytical Results Report |
AR-GKM-Al-Iron-Mn-Total_[your initials] |
Action Levels(s) |
Long-Term Irrigation Waters Short-Term Irrigation Waters |
Exceedance Flag |
X |
10.Name this report as desired in User Reports.
For this exercise, name the report as "ALE-GKM-Al-Iron-Mn-Total_[your initials]".
11.Save ![]() the User Report.
the User Report.
12.Select Go ![]() to run the report.
to run the report.
13.Select Crosstab ![]() in the toolbar.
in the toolbar.
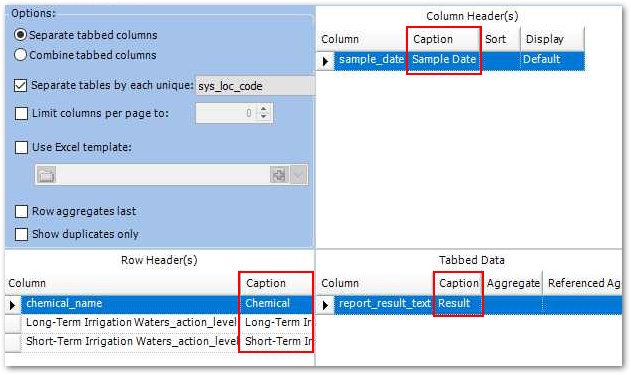
14.Design the Crosstab as desired by adding parameters to the Row Headers, Column Headers and Tabbed Data panes.
For this exercise, use the following parameters for the Crosstab configuration:
Configuration Pane |
Parameter |
|---|---|
Column Header(s) |
SAMPLE_DATE |
Tabbed Data |
REPORT_RESULT_TEXT |
Row Header(s) |
CHEMICAL_NAME |
LONG-TERM IRRIGATION WATERS_ACTION_LEVEL |
|
SHORT-TERM IRRIGATION WATERS_ACTION_LEVEL |
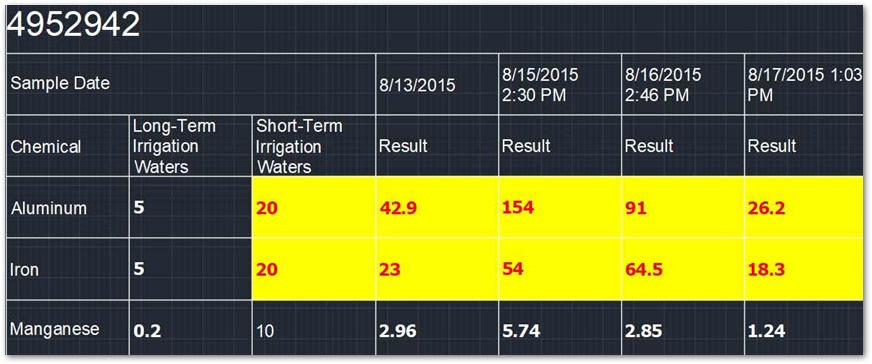
15.Change the captions, as desired, so the parameters are more descriptive.
16.Under the Row Header(s) pane, select the first action level Display and select Exceedance (bold).
17.Under the Row Header(s) pane, select the second action level Display and select Exceedance (custom).
18.Change the Background Color to yellow.
19.Change the Foreground Color to red.
20.Select the OK button.
21.In the Options pane, check Separate tables by each unique and select SYS_LOC_CODE from the drop-down list.
![]()
22.Select Go ![]() to run the report.
to run the report.
23.Select Publish ![]() .
.
24.Name the Crosstab report as desired.
For this exercise, name the Published Crosstab as "ALE Crosstab GKM AutoCAD Spider_<your initials>".
25.From the Parameters drop-down, select Prompt for Saved User Report.
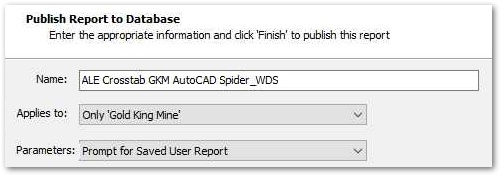
26.Select the Finish button.
Plot Spider Diagrams in AutoCAD
1.Return to AutoCAD and select Plot Spider Diagrams from the EQuIS for AutoCAD ribbon.
2.In the open dialog window, choose the Published Crosstab from the previous task.
3.Set the Size parameters as necessary.
For this exercise, change the Text Height to 8.00, the Header Column Width to 100, the Data Column Width to 50, the X Offset to 10.00, and the Y Offset to -10.00.
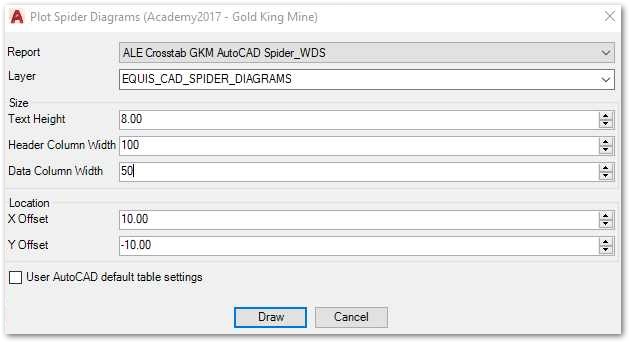
4.Select the Draw button.
5.Choose the same report parameters used in EQuIS Professional when designing the Crosstab in the previous task.
For this exercise, choose the following parameters:
Configuration Pane |
Parameter |
|---|---|
Saved Analytical Results Report |
AR-GKM-Al-Iron-Mn-Total_[your initials] |
Action Levels(s) |
Long-Term Irrigation Waters Short-Term Irrigation Waters |
Exceedance Flag |
X |
6.Select Go ![]() .
.
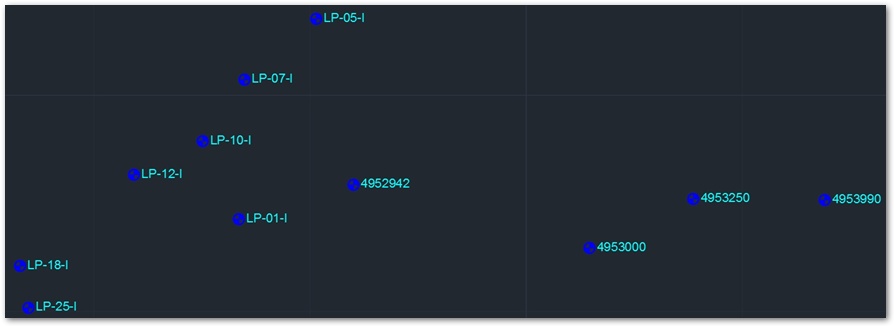
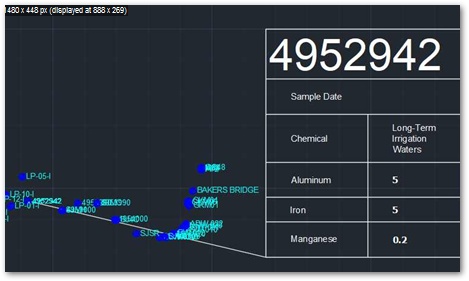
The spider diagrams are plotted next to each location as AutoCAD tables. The diagrams can then be edited or moved, just like any other tables in AutoCAD.
Add Leader Lines to Spider Diagrams
1.Select Add Leaders from the EQuIS for AutoCAD toolbar.
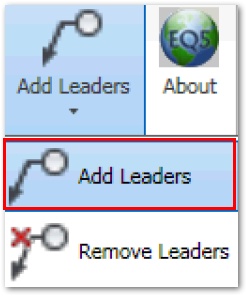
Leader lines will be added to connect the spider diagrams to their respective locations.
2.Select Add Leaders again after moving a table to update leader lines.
3.To remove leaders, select Remove Leaders from the Add Leaders drop-down.
|
Optional Exercise: View and Create Location Block Types |
Locations are symbolized in AutoCAD based upon the DT_ LOCATION.LOC_TYPE field. There are several location type blocks already set-up, and they can be found in the C:\Program Files\EarthSoft\EQuIS for AutoCAD\Blocks directory by default.
Monitoring Well.dwg:
Soil Boring.dwg:
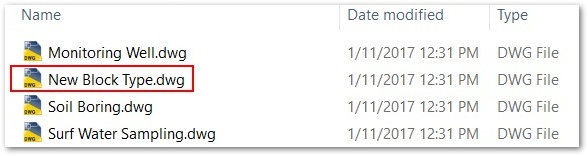
Create a New Location Block Type
1.In Windows Explorer, browse to C:\Program Files\Keynetix\EQuIS for AutoCAD\Blocks or the specified install directory.
2.Copy one of the existing block types by right-clicking and selecting Copy.
3.Right-click in the white space of the directory file and right-click and select Paste.
4.Rename the copied .dwg file to reflect the desired LOC_TYPE within EQuIS Professional.
5.Open the new .dwg and make any desired changes to the block contained in the file.
6.Save the changes, ensuring the .dwg retains the same file name and is saved in the same directory.