Overview
EarthSoft's EQuIS for ArcGIS is an interface for Esri’s ArcMap and ArcScene desktop applications. Query and map data from an EQuIS database. Display and effectively communicate project information with the EQuIS for ArcGIS interface.
To use EQuIS for ArcGIS, the following fields must be populated in EQuIS Professional with corresponding values (e.g., the IDENTIFIER and COORD_TYPE_CODE fields in DT_FACILITY and DT_COORDINATE have to match and be populated):
•DT_FACILITY.COORD_TYPE_CODE
•DT_FACILITY.IDENTIFIER
•DT_COORDINATE.COORD_TYPE_CODE
•DT_COORDINATE.IDENTIFIER
|
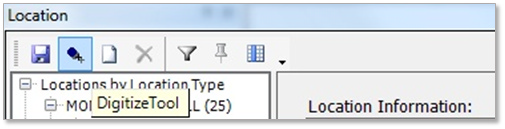
To determine if these fields have been populated properly, launch EQuIS Professional and view the location toolbar at the bottom of the screen. If this toolbar is not populated, the fields listed above have not been populated properly. |
Exercise Scenario
Prepare to do some more advanced analysis on Gold King Mine analytical data. First, plot the Gold King Mine locations in ArcMap. Then, add the following different types of layers to the map to display the results for Gold King Mine:
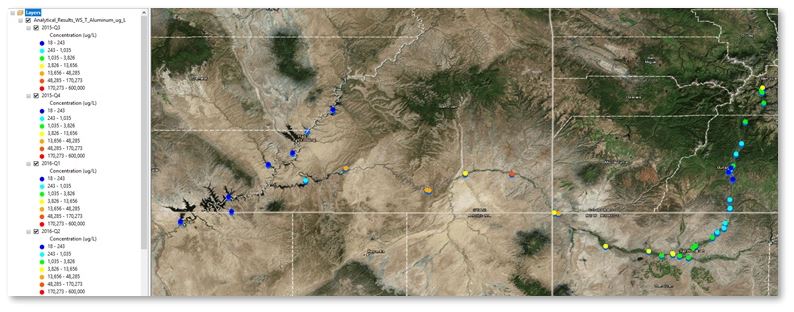
•Build a group of layers that shows aluminum concentrations at multiple dates.
•Build a pie chart layer that displays mercury, selenium and cadmium concentrations relative to each other.
•Plot spider diagrams that show results for mercury, selenium and cadmium concentrations.
•Animate a layer of arsenic at a quarterly interval.
|
Learn to plot EQuIS locations and generate layers with EQuIS data in ArcGIS. |
|
Exercise Objectives |
•Connect to the EQuIS for ArcGIS Interface
•Label EQuIS Features in ArcGIS
•Add New Locations and Modify Location Groups
•Build EQuIS Report Layers with EZView
Optional Exercise
•Set EarthSoft Styles in ArcGIS
Skills, Software and Permissions Required
•ArcGIS Desktop v10.0 or higher must be installed on the workstation
•EQuIS Professional v6.6 or higher must be installed on the workstation
•.NET Framework 4.0 or higher must be installed on the workstation
•Read/write permissions are required for the desired facilities
•Access to the Premier Graphics or Premier Data & Graphics EQuIS Professional Library
|
Objective: Connect to the EQuIS for ArcGIS Interface |
1.Launch ArcMap from Windows Explorer.
2.If the EQuIS for ArcGIS toolbar is not already available, select Customize> Toolbars> EQuIS for ArcGIS.
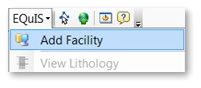
3.When ArcMap opens, select EQuIS> Add Facility from the EQuIS for ArcGIS toolbar.
4.The EQuIS Professional login screen will open. There are several options for adding a facility, which appear along the EQuIS Login toolbar. Hover the mouse over each option to display the tooltip, which describes the option in detail.
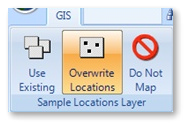
5.Select the Overwrite Locations option and ensure Open Tables is unchecked.
6.Double-click on the desired facility to login.
For this exercise, browse to the Gold King Mine facility and double-click on it to login.
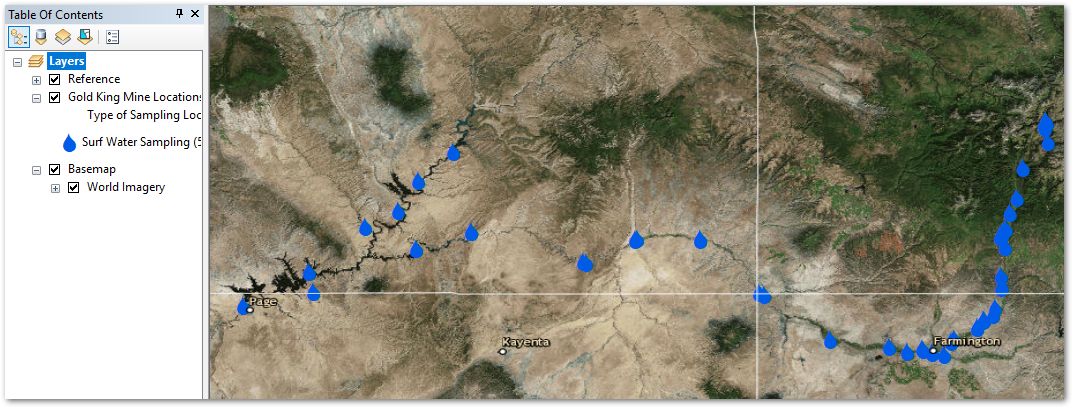
7.A layer is created in ArcGIS and displays the different types of sampling locations in the selected facility (this may take a few moments depending on the processor’s speed).
8.Note the Sample Locations layer is created in the Table of Contents.
9.Go to File> Add Data> Add Basemap.
10.Select the desired Basemap.
For this exercise, select Imagery with Labels.
11.Select Add.
|
Objective: Label EQuIS Features in ArcGIS |
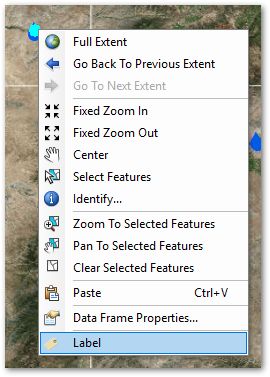
In ArcMap, label all the features in a layer by selecting Label Features in the Layer Properties. The EQuIS for ArcGIS interface also allows for selective labeling of individual features within layers. Learn to selectively label in the steps below.
1.Click Select Features ![]() from the ArcMap Tools toolbar.
from the ArcMap Tools toolbar.
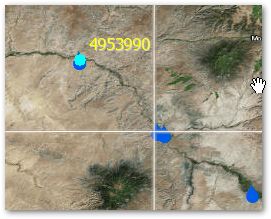
2.Click on one of the locations to highlight it.
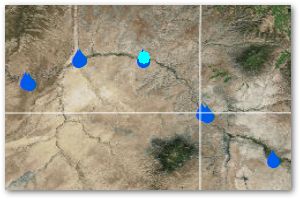
3.Right-click on the selected location and select Label from the drop-down menu.
|
Objective: Add New Locations and Modify Location Groups |
Tasks
•Add New Locations to EQuIS via ArcMap
•Add New Location Groups via ArcMap
Add New Locations to EQuIS via ArcMap
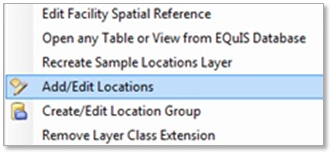
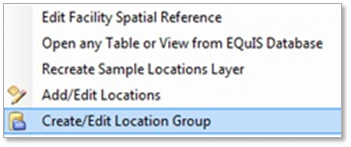
1.Select EQuIS> Utilities> Add/Edit Locations.
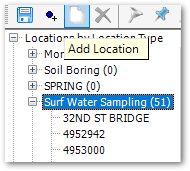
2.Expand Locations by Location Type, and expand the desired location type node. Review the data for the selected locations. Add or edit data as desired.
For this exercise, expand the Surf Water Sampling location type.
3.Single-click to highlight the location type.
For this exercise, single-click on the Surf Water Sampling location type.
4.Select Add Location at top left in the Location Form.
5.Enter the SYS_LOC_CODE and any additional information for the location.
For this exercise, enter SW_<your initials>.
6.Select the OK button.
7.Select the Digitize Tool.
8.Click the point on the map where the location should be added.
For this exercise, choose a point along the San Juan river in Utah.
9.Note that the coordinates have been populated for the new location in the Location form.
10.Save the changes.
11.Close the Add/Edit Location window.
12.Close ArcMap.
13.Re-open ArcMap.
14.Add the same facility.
15.Select the Overwrite Locations option located in the upper-left of the Add Facility window’s toolbar (and leave Open Tables unchecked) to ensure the new location has been added.
Add New Location Groups via ArcMap
1.Click Select Features ![]() .
.
2.Select one or more locations.
For this exercise, select the cluster of locations around the Four Corners on the map (Utah, Colorado, New Mexico, Arizona).
3.Select the EQuIS > Utilities > Create/Edit Location Group.
4.A new group is populated with the selected locations and a default GROUP_CODE.
5.Name the group as desired.
For this exercise, name the group "Four Corners <your initials>".
6.Save the new location group and close the Groups window.
|
Objective: Build EQuIS Report Layers with EZView |
Tasks
•Create Chemical Group Layers for Multiple Analytes
•Create Pie Charts with Multiple Analytes
•Plot Spider Diagrams in ArcMap
•Create an Animated Time-Based Layer
Create Chemical Group Layers for Multiple Analytes
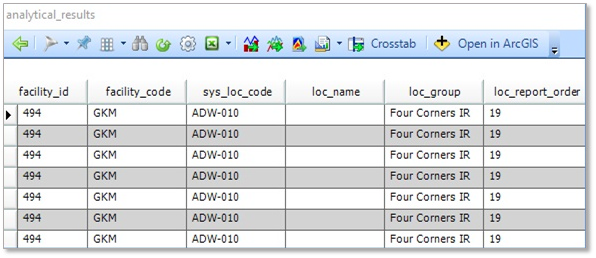
1.From the EQuIS for ArcGIS toolbar, select EQuIS EZView> Analytical Results.
2.Make the desired parameter selections in the Analytical Results window.
For this exercise, make the following parameter selections:
Parameter |
Selection |
|---|---|
Sample> Matrix |
WS |
Test> Fraction |
T |
Result> Individual> Analyte |
Aluminum |
Result> Unit |
ug/L |
Result> Detect Flag |
Y |
3.Select Go ![]() to review the results.
to review the results.
4.Select Open in ArcGIS.
5.Un-check Symbolize NDs and the Symbolize using LOG option in the ArcGIS Export Format wizard.
6.Check Create Group Layer and then from the drop-down menu, select “sample_date” and then Group Dates By “By Quarter”.
7.Select the Next button.
Create Pie Charts with Multiple Analytes
1.From the EQuIS Toolbar, select EQuIS EZView> Analytical Results.
2.Make the desired parameter selections in the Analytical Results window.
For this exercise, make the following parameter selections:
Parameter |
Selection |
|---|---|
Sample> Matrix |
WS |
Test> Fraction |
T |
Result> Individual> Analyte |
Cadmium, Mercury, Selenium |
Result> Unit |
ug/L |
Result> Detect Flag |
Y |
3.Select Go ![]() .
.
4.Click the Crosstab ![]() button from the tool bar.
button from the tool bar.
5.Review the output and then select the Open in ArcGIS button.
6.In the ArcGIS Export Format Wizard, ensure that the X_COORD and Y_COORD values are populated with X_COORD and Y_COORD, respectively. The other defaults may be used. Note that Pie Charts are the default symbology option.
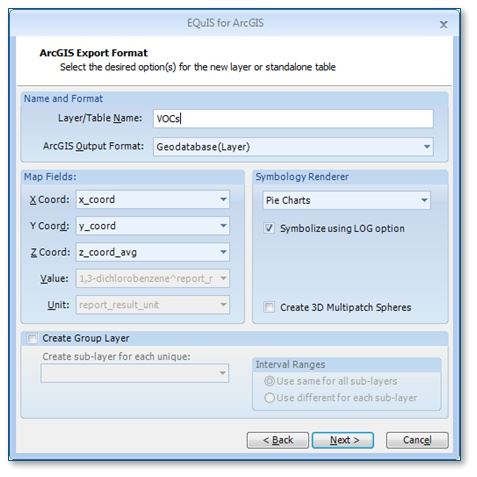
7.Un-check the option to Symbolize using LOG option.
8.Select the Next button.
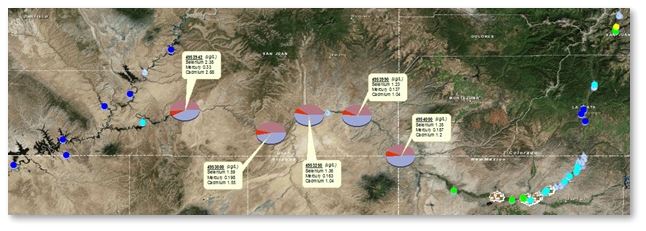
9.Click Select Features ![]() from the main ArcMap toolbar and select one or more pie charts.
from the main ArcMap toolbar and select one or more pie charts.
10.Right-click in the selected area and click Label to label these features on the map.
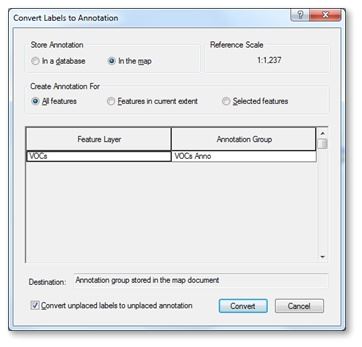
11. Right-click on the layer name in the Table of Contents and select Convert Labels to Annotation.
12. Select the In the map radio button under Store Annotation and click the Convert button.
13. Select the Select Elements tool ![]() .
.
14. Click on the labels on the map and drag them to a new location to better view the pie charts.
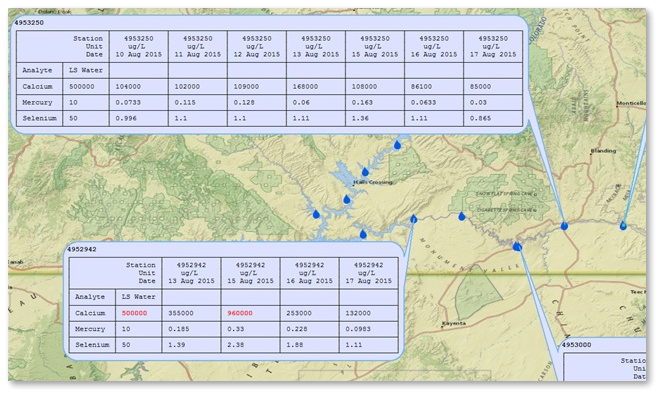
Plot Spider Diagrams in ArcMap
|
A Crosstab with the "Separate Tables by Each Unique: SYS_LOC_CODE" option enabled must be published prior to completing this exercise. For more details on building and publishing Crosstab reports, see the Build and Save Reports exercise. |
1.From the EQuIS drop-down, select EQuIS EZView> Plot Spider Diagrams.
2.Single-click the desired Published Crosstab.
For this exercise, select the Locations vs Chemicals Over Time (Spider Diagrams).
3.Select the Open button.
4.Select the desired report parameters and then Go ![]() .
.
For this exercise, make the following report parameters selections:
Parameter |
Selection |
|---|---|
Saved Action Level Exceedance II with Parameters Report |
Select_LS_Cd_Hg_Se |
5.Use the Select Elements tool to reposition the plotted spider diagrams as desired.
Create an Animated Time-Based Layer
1.From the EQuIS for ArcGIS toolbar, select EQuIS EZView> Analytical Results.
2.Make the desired parameter selections in the Analytical Results window.
For this exercise, make the following parameter selections:
Parameter |
Selection |
|---|---|
Sample> Type |
N |
Sample> Matrix |
WS |
Test> Fraction |
T |
Result> Analyte> Individual |
Arsenic |
Result> Unit |
ug/L |
3.Select Go ![]() .
.
4.Select Open in ArcGIS.
5.Give the query a Layer/Table Name in the EQuIS for ArcGIS Wizard.
6.Select the Next button to view the map.
7.Adjust the Symbology in the Layer Properties as needed.
8.In the Layer Properties for the Sample Locations layer, select the Time tab (Access this by right-clicking on the layer name).
9.Ensure the Enable Time on this Layer is un-checked and select the OK button.
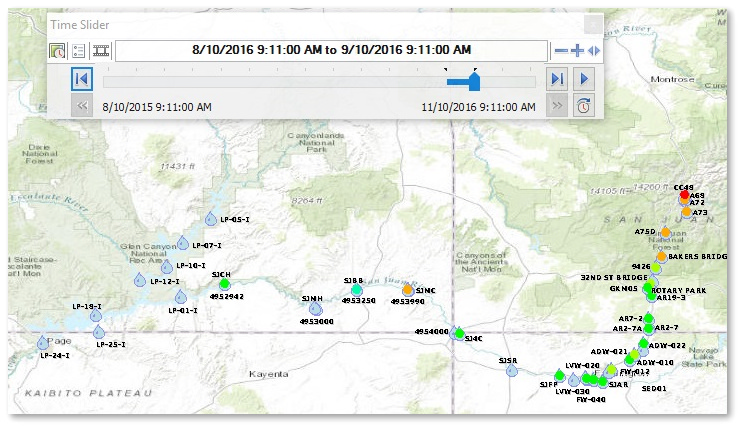
10.Select to Open the Time Slider Window ![]() from the toolbar.
from the toolbar.
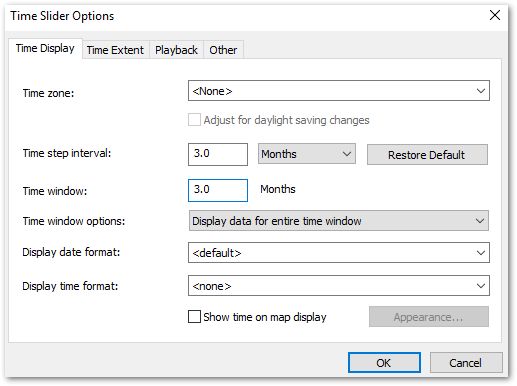
11.Select the Time Slider Options ![]() icon.
icon.
12.On the Time Display tab, change the Time step interval to the desired interval.
13.Change the Time Window to the desired range.
For this exercise, change both intervals to 3.0 Months.
14.On the Time Extent tab, restrict the full time extent to the new layer. Note that the start and end times automatically update.
15.On the Playback tab, change the duration to at the end of Slower.
16.Select the OK button to close the Time Slider Options.
17.Select Play ![]() to animate the results and view how the results change over time.
to animate the results and view how the results change over time.
18.To save the animation as an .avi movie file, select the Filmstrip ![]() from the Time Slider window, give the file a name, and select Export.
from the Time Slider window, give the file a name, and select Export.
19.Close the Time Slider window.
|
Optional Exercise: EarthSoft Styles in ArcGIS |
View or set default symbology for EQuIS for ArcGIS layers using the EarthSoft Styles file within ArcMap.
1.From the EQuIS for ArcGIS toolbar, select EQuIS> Options. The EQuIS for ArcGIS Options screen will open.
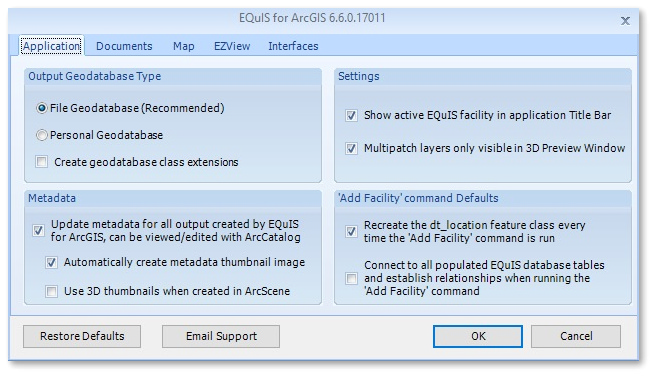
2.From the EQuIS for ArcGIS Options window, select the Map tab.
3.Select the EarthSoft Styles button ![]() to open the Style Manager window.
to open the Style Manager window.
4.Expand the EarthSoft.Style node from the tree on the left.
5.Select Marker Symbols to view or configure the types of symbols that are available for point features.
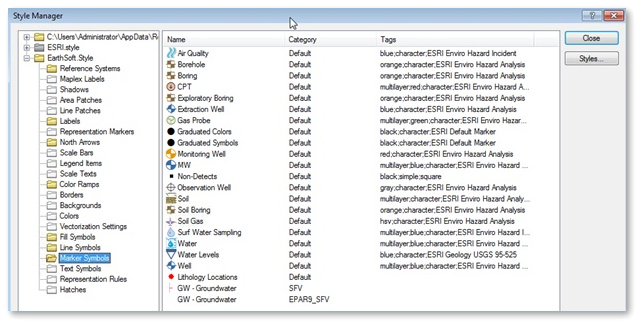
The Category corresponds to the EQuIS facility code (DT_FACILITY.FACILITY_CODE,). The interface will first look for facility-specific symbols, and then look for any of the other categories that match the value being rendered. For sample location mapping, the value being rendered is DT_LOCATION.LOC_TYPE by default and this corresponds to the entries in the name column in the style gallery.
6.Select the Close button to exit the Style Manager.