Overview
EQuIS Enterprise dashboards serve as containers for one or more widgets that can provide overviews (e.g., reports, charts, maps, etc.) about projects (i.e., facilities). Dashboards may contain data from one or more facilities. Permissions may be set to adjust the visibility or edit-ability of any dashboard for specific Enterprise users. For projects with similar analysis and/or reporting components, a dashboard may be set up as a template and then copied.
Enterprise dashboards are divided into Sections and Columns to provide a means of enhancing and controlling the arrangement of widgets. Each dashboard must have at least one section and one column, but users can add as many sections and columns as desired. Sections can also be "collapsible". If the collapsible property is set, then the user can show and hide sections as needed. This can be extremely useful if a dashboard has many sections.
What makes a good dashboard?
For the dashboard to be effective, it must easily communicate the desired information without distractions or elements that might cause confusion. Add widgets that support the presentation of meaningful and useful data—graphics, charts, maps and other visual indicators that can be easily monitored and interpreted. The dashboard layout design and the selected widgets should work well with human visual perception. Do not clutter the dashboard or make information difficult to read. Also, logically group widgets to display similar types of data and information. Example sections might include project or facility overview, constituents of concern, permit data, site characterization data, etc.
Exercise Scenario
We need to learn more about the Gold King Mine (GKM) project that is being managed with EQuIS. We want to login to EQuIS Enterprise and navigate to the Gold King Mine Site – Landing Page dashboard. We also want to explore other dashboards available within Enterprise to become familiar with the tool.
|
Become familiar with how to navigate and create dashboards in EQuIS Enterprise. Create a new dashboard that will be used for all of the widget training exercises. |
|
Exercise Objectives |
•Launch EQuIS Enterprise and Login to an EQuIS Facility
•Navigate EQuIS Enterprise Dashboards
•Create, Copy and Customize EQuIS Enterprise Dashboards for Specific Data Needs
Skills, Software and Permissions Required
•Internet Explorer 10 (or higher), Google Chrome, Mozilla Firefox or Microsoft Edge
•Editor permissions to desired facilities
•Editor permissions to desired dashboards and reports
•Viewer permissions to the groups and folders object type
•Viewer permissions to all non-administrator widgets
•Creator permissions on the dashboard, EDDs and reports object types
|
Objective: Launch EQuIS Enterprise and Login to an EQuIS Facility |
1.Open an Internet browser.
2.Enter the Enterprise URL in the address bar.
For this exercise, enter in the Enterprise URL provided by the EarthSoft Training Department.
3.If required, enter the Username and Password on the EQuIS Enterprise Login page and then select Login. It is recommended to check the Stay signed in box to facilitate use of the program.
For this exercise, enter in the credentials provided by the EarthSoft Training Department.
4.On the right side of the top of the EQuIS Enterprise frame, click Select Facility ![]() to open the Facility dashboard and then connect to the desired facility.
to open the Facility dashboard and then connect to the desired facility.
For this exercise, choose the North America folder and then the Gold King Mine facility.
|
Objective: Navigate EQuIS Enterprise Dashboards |
The following activities are designed to familiarize users with the various dashboards available within EQuIS Enterprise and how to navigate between them. Specific details regarding various widgets available on the dashboards will be covered in separate exercises.
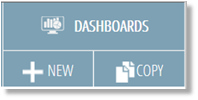
1.Select the Dashboards drop-down menu from the top-right corner of the current dashboard.
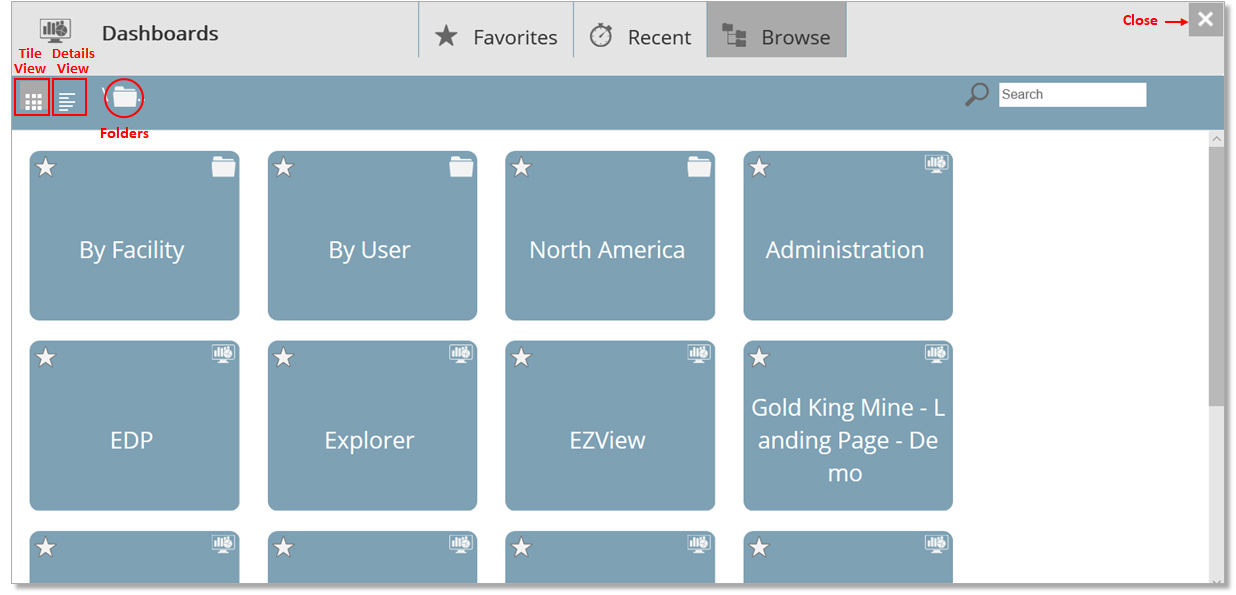
2.The Dashboards window will open and show the dashboards and folders currently available. These include the default dashboards provided in Enterprise: Administration, EDP, Explorer, EZView, New Dashboard, Notices, and Welcome dashboards. Other dashboards may also be available, depending on the EQuIS database connection and other previously created dashboards. Some of these dashboards will be used in other exercises. Also included are the "By Facility" and "By User" folders. Note that the dashboards and folders can be displayed using either tile or details view. Toggle back and forth to determine which view you prefer. The Dashboards window can be closed using the ![]() in the upper right hand corner of window.
in the upper right hand corner of window.
|
While selecting the |
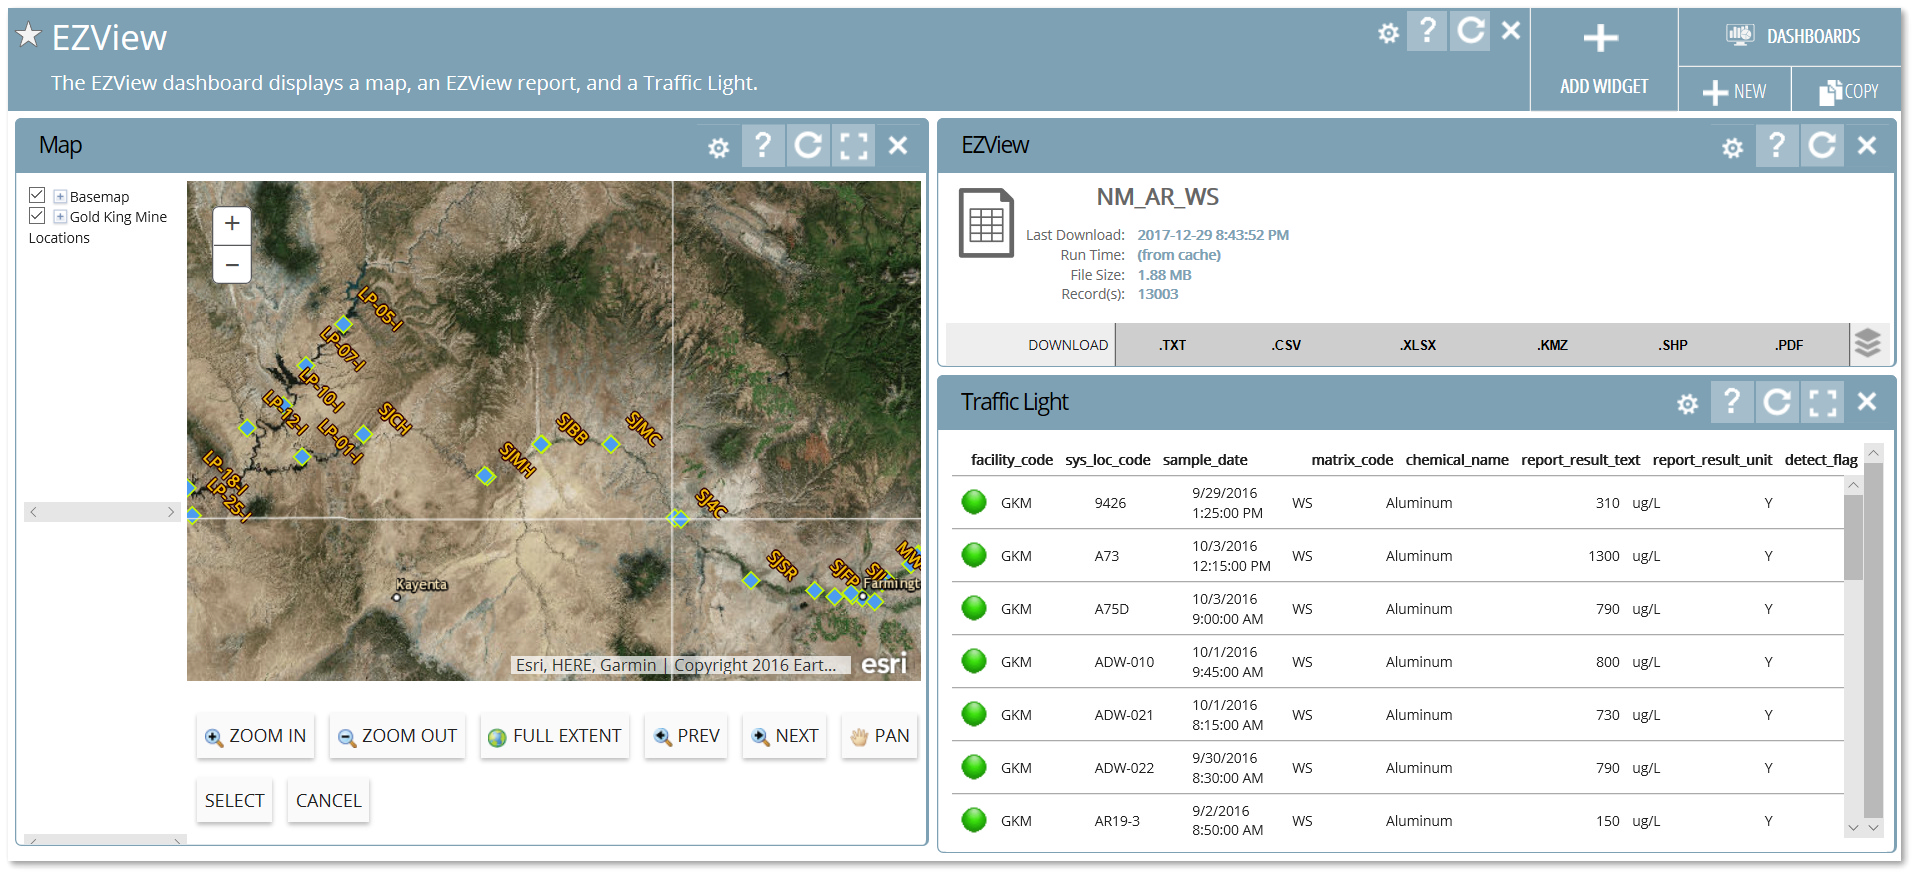
3.Select the EZView dashboard. This dashboard contains a Map widget, an EZView report widget and a Traffic Light widget. These widgets can be customized for a particular facility, as shown in the image below. By default, these widgets will be empty.
4.To facilitate learning how dashboards and widgets can be used to help understand and assess data at project sites, a demonstration dashboard has been constructed for the Gold King Mine site. Select the Dashboard drop-down menu from the top-right of the current dashboard and then select the Gold King Mine - Landing Page - Demo dashboard.
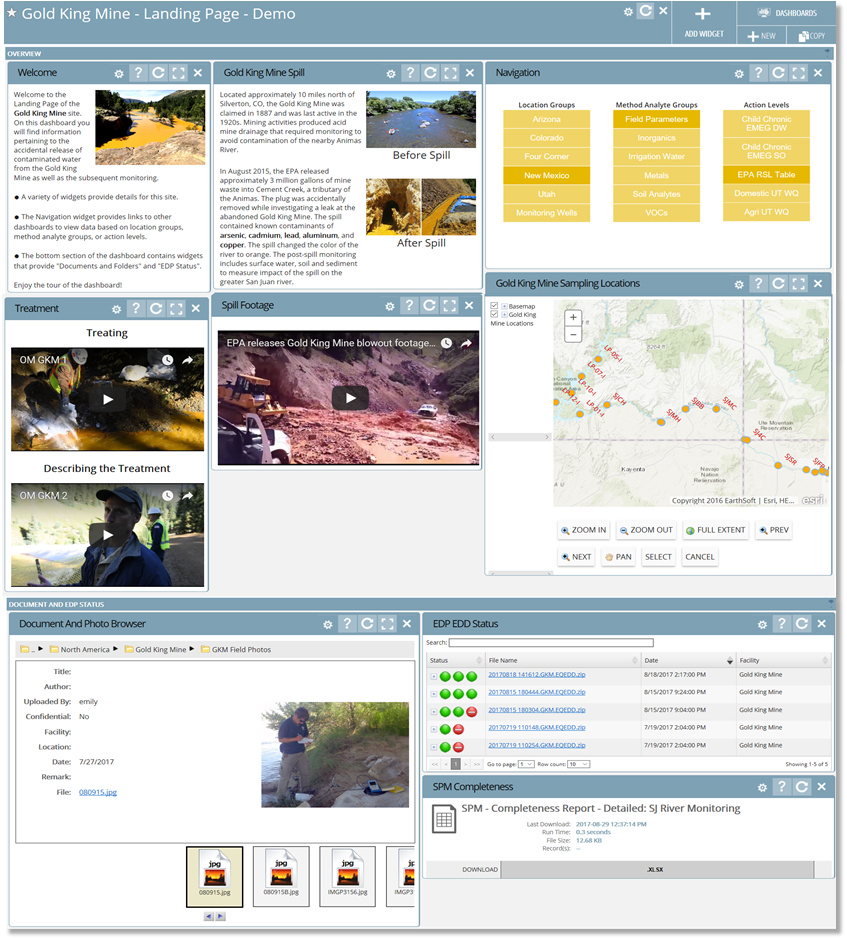
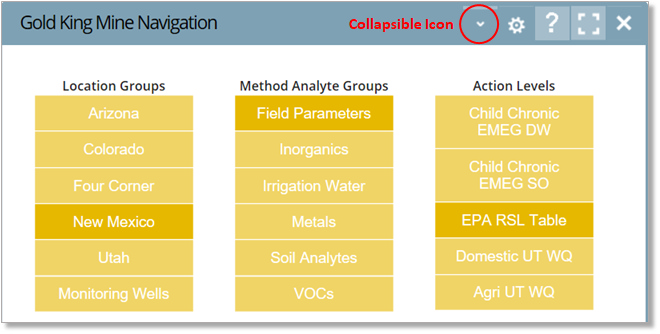
5.The demo dashboard is highly customized and populated with a variety of widgets. The widgets are grouped into two sections: "Overview" and "Document and EDP Status". HTML widgets are used to provide overview text and videos. A Map widget displays all of the sampling locations. A Document and Photo Browser widget provides access to a plethora of site photos and other relevant documents. A Navigation widget allows links to other pages based on location groups, method analyte groups, or action levels.
6.Both sections of the demo dashboard are collapsible. There is a small "down arrow" at the far right of the section header. Hover the mouse over the right end of the Overview section header and click on the Collapsible icon. The Overview section will collapse and all the widgets will be hidden. Click on the Collapsible icon again (now an "up arrow") and all of the widgets will be restored.
7.Widgets can also be collapsible. The Gold King Mine Navigation widget properties are set to allow the widget to be collapsible. Click on the Collapsible icon on the widget ribbon. The widget will collapse and all the contents will be hidden. Click on the Collapsible icon again (now an "up arrow") and all of the contents will be restored.
![]()
8.Go to the Gold King Mine Locations Map widget and select Maximize ![]() on the widget ribbon. This will display the map full screen. Zoom in and out. Pan around. Turn layers on and off. To close the Map widget and return to the dashboard, select
on the widget ribbon. This will display the map full screen. Zoom in and out. Pan around. Turn layers on and off. To close the Map widget and return to the dashboard, select ![]() in the upper right-hand corner of the widget.
in the upper right-hand corner of the widget.
|
Using |
9.Use the Document and Photo Browser to see images of the site. Watch some of the videos. Click on some of the links in the Navigation widget to view other pages to see other types of widgets, such as Map widgets, Drilldown widgets, Time Series Chart widgets, and many others. Enjoy the tour!
|
To display a Dashboard as a Favorite, select the |
|
Objective: Create, Copy and Customize EQuIS Enterprise Dashboards |
Tasks
•Copy an Existing Dashboard
•Create and Customize a New Dashboard
Copy an Existing Dashboard
1.Select Copy ![]() from the top-right corner of the current dashboard to copy an existing dashboard.
from the top-right corner of the current dashboard to copy an existing dashboard.
For this exercise, copy the Gold King Mine - Landing Page - Demo dashboard.
2.The new dashboard will have a default title that includes the original dashboard title concatenated with the username and date. To rename the dashboard, select Modify Properties ![]() from the Dashboard ribbon. This will open the Dashboard Editor window.
from the Dashboard ribbon. This will open the Dashboard Editor window.
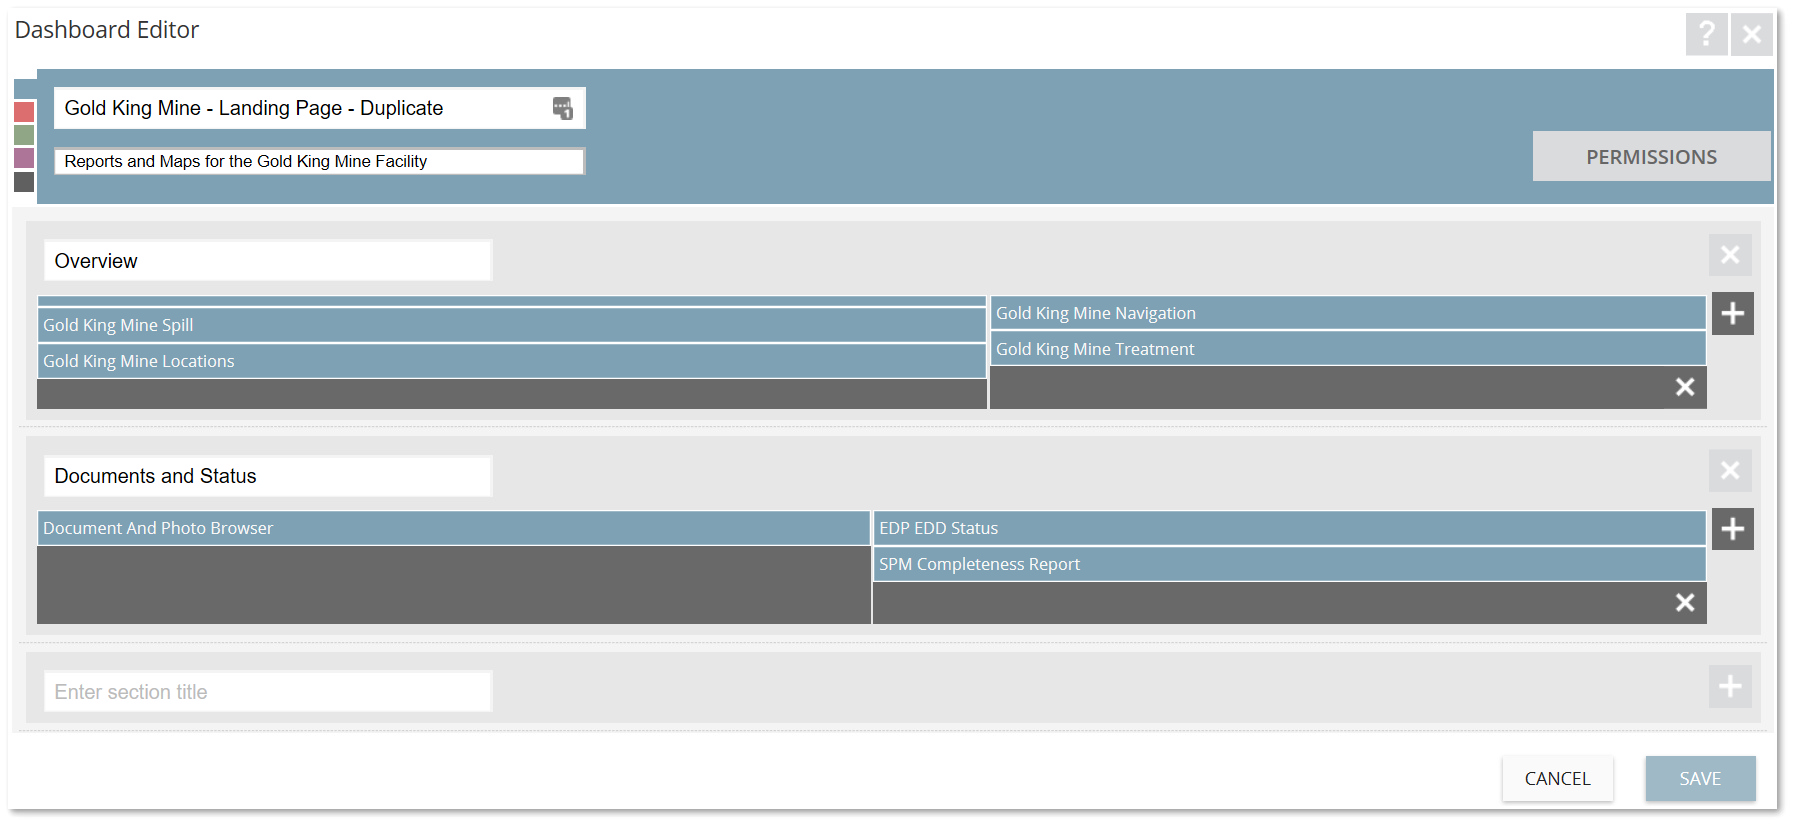
3.In the Dashboard Editor window, rename the dashboard to the desired name by typing over the default title in the dashboard Title box.
For this exercise, rename the dashboard to "Gold King Mine - Landing Page - Duplicate”.
4.If desired, add information into the Description field (the blank box beneath the Title box).
For this exercise, enter "Reports and Maps for the Gold King Mine Facility” in the Description field.
5.Ensure the desired permissions of the Dashboard are set. Permissions may be set to grant or deny Owner, Editor, and/or Viewer access for the dashboard to a particular user or role.
6.Select the Save button to return to the main dashboard page. Note the changes to the Dashboard ribbon.
7.The dashboard can be deleted by selecting ![]() on the dashboard ribbon.
on the dashboard ribbon.
Create and Customize a New Dashboard
When a new dashboard is created, two sections with two columns each will automatically be generated. Two empty HTML widgets will also appear on the dashboard, one in each section. The default sections and widgets are intended to be placeholders. New dashboards will require customization.
1.Select New ![]() from the top-right corner of the current dashboard to create a new dashboard.
from the top-right corner of the current dashboard to create a new dashboard.
2.The new dashboard will have a default title. To rename the dashboard, select Modify Properties ![]() from the Dashboard ribbon. This will open the Dashboard Editor window.
from the Dashboard ribbon. This will open the Dashboard Editor window.
3.In the Dashboard Editor window, rename the dashboard to the desired title by typing over the default title in the dashboard Title box.
For this exercise, rename the dashboard to "Gold King Mine <your initials>”. Do not include the bracket symbols as these are not acceptable characters.
4.If desired, add information into the Description field (the blank box beneath the Title box).
For this exercise, enter "Reports and Maps for the Gold King Mine Facility” in the Description field.
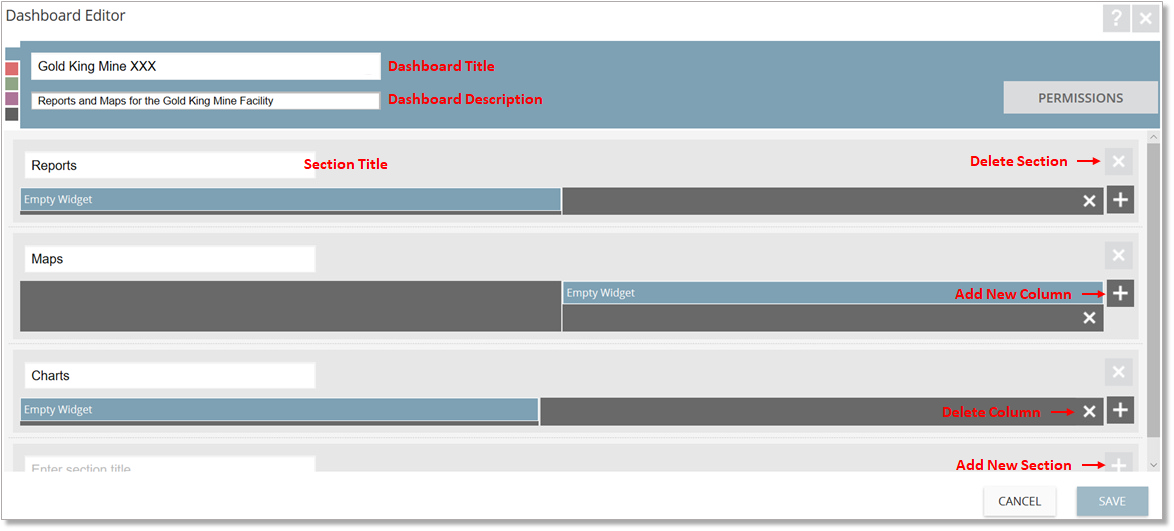
5.Customize the number and format of each section as desired. Change the section title. Add more columns to a section by clicking on the ![]() icon within the desired section. Columns may be re-sized by dragging the columns on the dashboard. Add a new section by clicking on the
icon within the desired section. Columns may be re-sized by dragging the columns on the dashboard. Add a new section by clicking on the ![]() icon at the bottom of the dashboard editor window. Remove an existing section and all associated widgets by clicking on the
icon at the bottom of the dashboard editor window. Remove an existing section and all associated widgets by clicking on the ![]() icon.
icon.
For this exercise, enter "Reports” in the title of the first section and "Maps” in the title of the second section. Add a third section and title it "Charts". Then add a second column to the Charts section. The new column will not be immediately visible, but will appear after the changes are saved.
6.Ensure the desired permissions of the dashboard are set. Permissions may be set to grant or deny Owner, Editor, and/or Viewer access for the dashboard to a particular user or role.
7.Select the Save button to return to the main dashboard page. Note the changes to the dashboard.
8.Add at least one widget to the dashboard by selecting Add Widget ![]() from the Dashboard ribbon. Select the desired widget. The widget will appear on the dashboard, by default in the upper left portion of the first section of the dashboard.
from the Dashboard ribbon. Select the desired widget. The widget will appear on the dashboard, by default in the upper left portion of the first section of the dashboard.
For this exercise, add an HTML Widget. Notice that the widget will appear in the top left side of the Report (first) section of the dashboard.
9.To add information to the widget, select Modify Properties ![]() from the Widget ribbon. This will open the Widget Editor window. Available options within the Widget Editor window will vary depending on the type of widget. Select the Save button to keep changes and return to the main dashboard page.
from the Widget ribbon. This will open the Widget Editor window. Available options within the Widget Editor window will vary depending on the type of widget. Select the Save button to keep changes and return to the main dashboard page.
For this exercise, rename the widget by entering "GKM Overview” in the widget Title box. Text can be added to the HTML widget by typing anything on the HTML tab, however, there will be no formatting unless HTML tags are applied. On the HTML tab enter "<p align="Justify">The Gold King Mine Site, located approximately 10 miles north of Silverton, CO, was claimed in 1887 and was last active in the 1920s. Mining activities resulted acid mine drainage that required monitoring to avoid contamination of the nearby Animas River. </p>". Select the Save button.
10.Widgets can be moved around the dashboard by right-clicking on the widget ribbon and dragging the widget to the desired location. Note that the dashboard is divided into sections, which control the alignment of widgets.
For this exercise, select the Empty Widget in the Maps section of the dashboard and drag it to the Reports section of the dashboard. Notice that the widget must be dragged entirely into the new section to move.
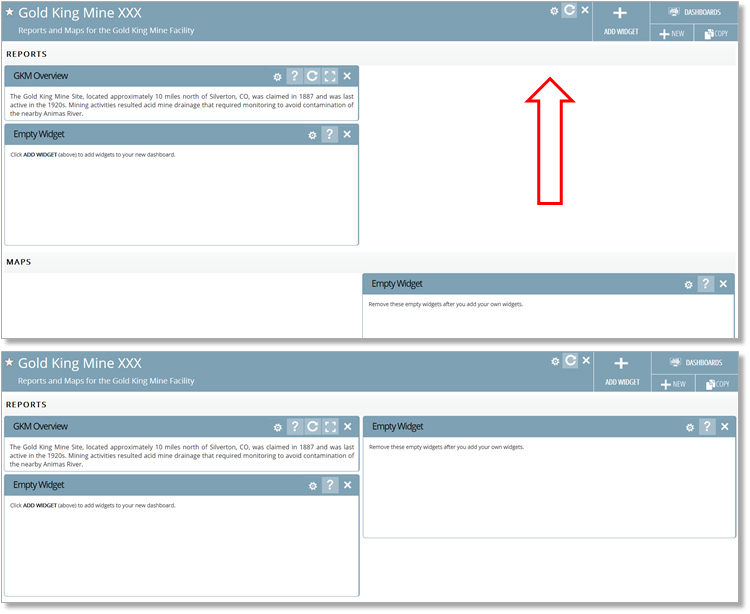
11.The size of widgets can be modified by adjusting the column widths. Mouse over the space between columns until the cursor changes to "double arrow heads". Re-size columns and widgets as desired to display on the dashboard.
For this exercise, move the column break in the Reports section to the left and to the right and then back to the center of the section.
12.Delete ![]() the Empty Widgets to remove them as placeholders.
the Empty Widgets to remove them as placeholders.
For this exercise, delete all the empty widgets from the three sections.